Evolutionary
Genetic Analysis with DNA data
Principles of Phylogenetic Systematics &
Classification (Review)
"Natural
Classification"
accurately reflects phylogeny
Classification is a hypothesis
of evolutionary relationships
Inferring the
nature of evolutionary
relationship
A complete evolutionary "tree"
describes position of any 'twig', with respect to all
others
Optimization
criterion: How to choose 'correct '
solution
Distance: amount of evolutionary
change between twigs
How similar
(alike) are they?
phenetic: distance measured between tips
"As the crow flies" from
one twig to another
patristic:
distance measured along connecting branches
"As the ant runs" from one twig to another
Relationship: pattern of connection
between twigs
How closely
related are species?
cladistic relationship: "As the branches
join" back to
Most
Recent Common Ancestor (MRCA)
How do twigs join lower 'stems', 'branches',
'limbs', etc. in tree?
Phenetic
& Cladistic criteria
agree, iff rates of evolution are constant
If evolutionary rates differ, closely related organisms
appear
dissimilar
Ex.: Crocodilia
more similar to Squamata (lizards & snakes) BUT more
closely related to birds
Historically: Reptilia include scaly,
four-legged crocs, lizards & snakes, turtles &
tortoises, Dinosaurs (?)
Aves include feathery,
two-legged, two-winged creatures with evolved adaptation for
flight
Mammalia include furry,
four-legged,suckling creatures with homeothermy
Problem: similarity
is subjective
Theoretical & technical breakthroughs late
1960s ~ 1990s ~ 21st cent.:
Theory of Phylogenetic
Systematics ("Cladistics") formalized
Molecular data (allozymes
& DNA) replace morphology as primary data
for phylogenetic inference
Computational power increases:
e.g., Likelihood calculations possible
GenBank database of taxon-specific sequences
DNA sequencing capacity increases
e.g., inferences based on complete genomes possible
***Patterns
of evolutionary relationship to be understood from molecular
data;
then, history
& patterns of organismal evolution to be analyzed based on relationships
***
Phenetic analysis
with Single
Nucleotide Polymorphism (SNP) DNA data
Simplest measures: # pairwise differences (p)
% sequence similarity (S)
p-distance = (1 - S)
Ex.: mtDNA distance matrix
for Great Apes
HOMEWORK:
5x5 Ape matrix
Patterns of similarity inferred from UPGMA cluster analysis
[Unweighted
Pair Group Method, Arithmetic
averaging],
Sequential Agglomerative Hierarchical Nesting (SAHN) algorithm
algorithm: set of instructions for
repetitive task
In (n) x (n) matrix, join most similar
pair:
re-calculate (n-1) x (n-1)
matrix, re-join,
& so on, until last pair joined
Clustering
results shown as phenogram:
diagram of phenetic similarity
Similarity estimates relationships under
certain assumptions
But Phenogram "Tree"
UPGMA method assumes rates of evolution equal
so branch tips "come
out even" (contemporaneous)
Rate differences lead to incorrect trees
HOMEWORK: Practice problems
for UPGMA phenogram
calculations
Alternative phenetic methods
Neighbor-Joining (NJ) analysis does not assume
rate equality
NJ allows branch lengths
proportional to change: tips
come
out uneven
algorithm joins nodes, rather
than tips
More realistic, recognizes stochastic "Molecular
Clock"
Differential weighting of
nucleotide substitutions
accord greater 'significance' to certain classes of change
Ex.: Kimura 2-parameter (K2P) model
treats Transitions (Ts) & Transversions (Tv)
differently
K  Transition
Bias = [Ts] / [Tv]
Transition
Bias = [Ts] / [Tv]
Tv : Ts :: 2 : 1: expect K = 0.5
But: Tv rare for close comparisons,
more common for distant relationships
Set
K according to nature of evolutionary problem under
consideration:
K = 1 for close comparisons, K
= 3 for moderate comparison
K = 10 or Tv-only
for distant comparisons
Cladistic
Analysis with SNP data
Principles of homology
& analogy applied to nucleotide changes
Rely only on
shared derived (synapomorphic) Single
Nucleotide Polymorphisms (SNPs)
avoid shared
ancestral (symplesiomorphic)
SNPs,
SNPs unique to single taxa (autapomorphies),
convergent
nucleotides between unrelated
taxa (homoplasies).
Choice of
preferred hypothesis made on Principle of Maximum
Parsimony
Parsimony: simpler
hypothesis preferred
Ex.: If complex trait occurs in multiple species,
more parsimonious to hypothesize it evolved only once
=> Trait evolved
in single common ancestor
Ex.: Evolution
of ice-breeding in Phocidae
("True" seals),
from ecological & molecular parsimony perspectives
Evolutionary parsimony:
Hypothesis that requires fewest character changes
preferred
In molecular systematics,
that which requires fewest SNP
changes
"Four-Taxon Problem" & "Three-Taxon
Statement":
Four taxa A,
B, C, & D have three hypotheses of
relationship:
"A is more closely related to B (or
C, or D) than it is to either of the others"
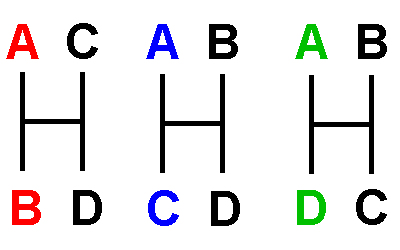
Evaluate
alternative hypotheses as:
"X and Y are more closely related to each
other than either is to Z"
Alternative hypotheses shown as networks with
branches & internode
Count changes
at informative SNPs that
favor each hypothesis
Hypothesis that requires fewest changes
is Maximum Parsimony
explanation:
AKA 'Minimum
Length' or 'Minimum
Spanning' solution
Modifications: use K2P criteria, weight # changes by K
= [Tv] / [Ts]
Protein Parsimony: count amino acid substitutions only
Count 1st & 2nd position SNPs only
HOMEWORK: What triplets are
exceptions? Why?
Alternative search strategies
necessary for large numbers of taxa
Why not
write out all possible trees, identify shortest?
Because: Computational effort (run-time &
CPU) linear wrt # nucleotides
hyper-exponential wrt # taxa [Math is "Hard"]
# networks mounts
up:
for
t = 4, 5, 6, 7 taxa, # networks
= 3, 16, 106, 945
"The Felsenstein
Zone" :
# bifurcating rooted trees for
t
taxa = [(2t -
3)!] / [(2{t - 2})(t - 2)!]
ex.: if t = 10, # trees =
2,027,025
if t = 21, # trees = 3.198 x 10²³: Half of Avogadro's Number
if t = 52, # trees > Eddinger's Number,
# of molecules in Universe (~1080)
Heuristic methods seek approximate solutions
for
computationally difficult (~ impossible) problems
Ex.: Parable of the "Near-sighted
mountain climber"
Branch & Bound
Search "rules out"
sub-optimal trees, for n ~ 20
Branch-Swapping methods "shakes tree" for local improvements
Placing the Root of a Tree: Inferring origin & direction of
evolutionary change
Evolutionary
trees are networks
with roots
With four taxa, network
has four branches & one internode
Root indicates
relationship with common ancestor
Root can
be placed on any branch
or internode
Thus five
possible rooted trees
(cladogram) for four-taxon
network
All
equally
parsimonious:
Not all place any given pair of taxa as each
others closest relatives
Some
make
shared SNPs symplesiomorphic
Outgroup
rooting
Include taxon known
to be less closely related
to any ingroup taxon than
they are to each other
Call this an outgroup
Ex.: Use feliform as
outgroup to caniform problem
Note cladistic tree has same topology as NJ phenogram
Ex.
Wolffish (Anarhichas):
use a Zoarcoid fish ( Johnstone
et al. (2007) )
Midpoint
rooting
Place root halfway between two
most divergent taxa
Assumption: molecular evolution is clock-like
HOMEWORK: Practice
four-taxon cladistic
problems
Maximum Likelihood analysis
Different approach to
evolutionary trees based on Bayes
Theorem
Likelihood
methods look for most probable tree ("least
unlikely" = "maximally likely"),
given a priori model of evolutionary events
Given
estimates of all possible SNP rates among
A, C,
G, & T (n =
12)
Calculate probability
of simultaneous occurrence
of all events
necessary to produce any particular tree
Any particular tree is (extremely) unlikely,
but one tree is
least unlikely ( = maximally likely)
Ratio
of likelihoods expresses how much better
wrt any other
Heuristic
example: five-card stud poker with
standard 52-card deck
Comparative Results of three phylogenetic methods for Five-taxon
Panda Problem: NJ,
MP, & ML methods
Statistical tests determine
confidence in branching order
Bootstrap Analysis: a re-sampling
technique
Statistical tests involve re-sampling / replication /
repetition of experiment:
This is ~ inconvenient with DNA data
Suppose sample data set of n bases
accurately estimates parametric
data (complete genome)
Re-sample n sites (with replacement) ~3,000
times
Repeat
phylogenetic analysis on each 'new' set:
Among all
of these sets,
How often do same clades / clusters appear?
"50% bootstrap support"
identifies groups that occur more frequently than all others
combined
Download & install MEGA [Molecular Evolutionary
Genetic Analysis]
software [Version 12 as of
November 2025]
GenBank
taxonomy links to Carnivora
/ Primata
Lab Exercise:
What does molecular systematics tell us about the evolution
of mammalian Carnivora?
What are the relationships of Civets,
Mongooses, & Hyaenas?
How many times have aquatic carnivores evolved?
Is there less morphological diversity in Feliform
than in Caniform carnivores?
(and how are the Giant Panda and Lesser Panda related?)
HOMEWORK: Results
for the Panda Problem
from UPGMA, Neighbor
Joining, Maximum Parsimony, & Maximum Likelihood
methods
Phylogeographic analysis of codfish
& relatives (Gadidae) (Coulson
et al. 2006)
Phylogenetic
relationships of Wolffish (Anarhichas spp.)
(Johnston et al. 2007)
A molecular understanding of the evolutionary history of birds
(Jarvis et al. 2014)
Applications to the evolution of COVID-19
SARS virus