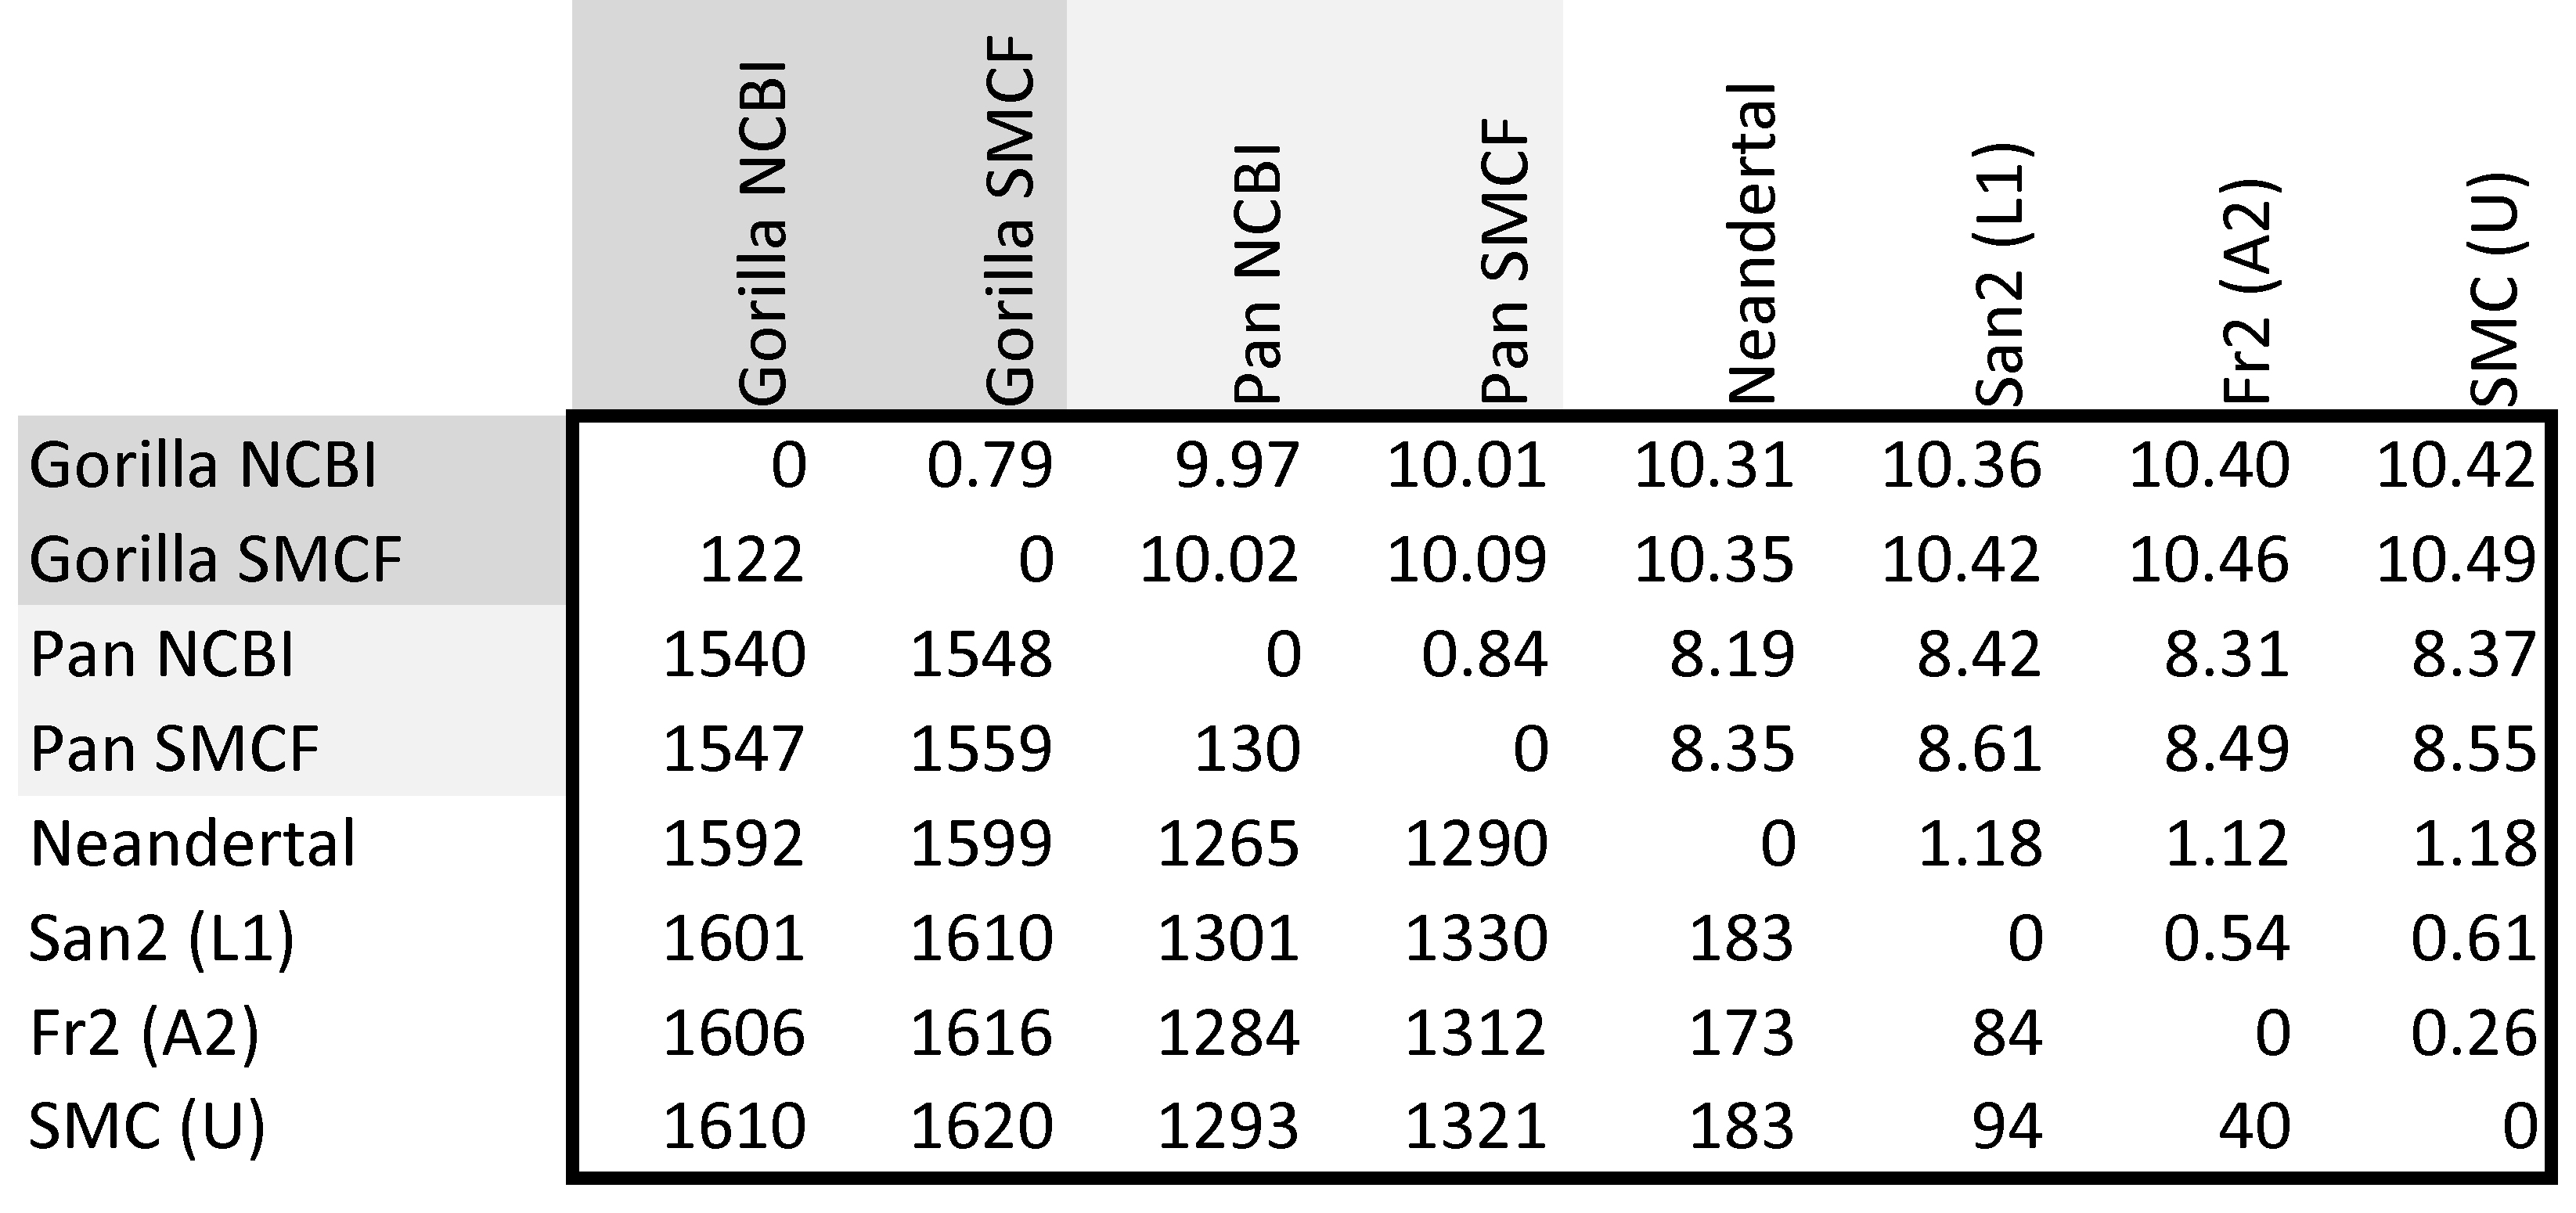
Pairwise mtDNA SNP differences among Great Ape mitochondrial DNA genomes
Observed counts of SNP differences over
the 15,447 bp coding region of mtDNA are given
below the diagonal (lower left matrix). Percentage
distances are given above the diagonal (upper
right matrix), over the same region. Note that the
measured genetic difference between either chimp and any
Anatomically Modern Human (AMH) is 8.31 ~
8.61%, essentially the same as between Chimps (Pan
troglodytes) & Neandertals 8.19 - 8.35%.
Matrices of SNP data (or other phenetic data) comprise three parts, a diagonal of '0's from the upper left to the lower right that indicates identity of a sequences to itself, a lower-half-matrix below the diagonal, and an upper-half-matrix above the diagonal. The lower matrix shows counts, which are therefore differences. The upper matrix shows counts divided by total lengths, which are therefore distances (d), and can be converted to similarities (s) as s = 1 - d. For example, the two individual gorillas (Gorilla gorilla) differ by 122 SNPs out of 15,447 sites examined, thus the distance between the two mitogenomes is d = 122 / 15,447 = 0.79% as shown or s = 1 - 0.79% = 99.21%.
For the same reasons that Chi-Square calculations are performed on count data, phenetic calculations are performed on count rather than percentage data. Numerical answers will be analogous, but estimation of statistical support requires counts.
Data after SMC Flynn & SM Carr (2015); Text material © 2025 by Steven M. Carr