He = 1 -
i=1
Genetic variation in populations
described by genotype
& allele frequencies
(not "gene" frequencies)
Consider a diploid autosomal
locus with two alleles & no dominance
(=>
semi-dominance: AA , Aa , aa
phenotypes distinguishable)
x = # AA y = # Aa z = # aa so that x + y + z = N (sample size)
f(AA) = x / N f(Aa) = y / N f(aa) = z / N
f(A) = (2x + y) / 2N f(a) = (2z + y) / 2N
or f(A) = f(AA) + 1/2 f(Aa) f(a) = f(aa) + 1/2 f(Aa)
let p = f(A), q = f(a) p & q are allele frequencies
Properties of p & q
p + q = 1 p = 1 - q q = 1 - p
(p + q)2 = p2 + 2pq + q2 = 1
(1 - q)2 + 2(1 - q)(q) + q2 = 1
p & q interchangeable wrt [read, "with respect to"] A & a
q typically used for
rarer,
recessive,
deleterious (disadvantageous), or "interesting" allele
BUT 'common'
& 'rare' are statistical properties
'dominant' & 'recessive' are
genotypic properties
'advantageous' & 'deleterious'
are phenotypic properties
*** combination of these properties is
possible ***
What happens to p & q in one generation of random mating?
Consider a population of monoecious organisms that
reproduce by random union of gametes
(sea urchin / "tide pool"
model)
(1)
Determine expectation
of
parental
alleles coming together in various genotype combinations
expectation: the
anticipated value of a variable
not quite the same as probability
Proofs by probability,
binomial expansion, & Punnet Square methods
all
show
that expectation of f(AA) = p2
expectation of f(Aa) = 2pq
expectation of f(aa) = q2
(2) Re-describe offspring allele frequencies f(A') & f(a')
f(A') = f(AA) + 1/2 f(Aa)
= p2 + (1/2)(2pq) = p2 + pq
= (p)(p+q) = p' = p
f(a') = f(aa) + 1/2 f(Aa)
= q2 + (1/2)(2pq) = q2 + pq
= (q)(p+q) = q' = q
p2 : 2pq : q2 are Hardy-Weinberg
expectations (cf. Mendelian
ratios 1 : 2 : 1 )
Hardy-Weinberg Expectation (HWE) obtained under more general conditions
(1) multiple alleles / locus
p + q + r = 1
(p + q + r)2 = p2
+ 2pq + q2 + 2qr + r2
+ 2pr = 1
Proportion of heterozygotes (H
= 'heterozygosity')
measures genetic variation at a locus
Hobs = f(Aa)
= observed heterozygosity
Hexp = 2pq
= expected heterozygosity
(for two alleles)
He = 2pq + 2pr + 2qr = 1 - (p2 + q2 + r2) for three alleles
n
He = 1 - ![]() (qi)2 for n
alleles
(qi)2 for n
alleles
i=1
where qi = freq. of i
th allele of n alleles at a locus
Ex.: if q1 = 0.5, q2
= 0.3, & q3 = 0.2
then He = 1 - (0.52 + 0.32
+ 0.22) = 0.62
***
HOMEWORK:
Calculate He 1) if
q1 = 0.4, q2 =
0.3, q3 = 0.2, & q4 = 0.1
2)
for a locus with 10 or 100 alleles, all at
equal frequency
3) with one allele at q = 0.5, and 9 or
99 at equal frequency
Hint:
is there a shortcut?
(2) sex-linked loci
iff [read: "if and only
if"] allele frequencies in males & females equal
If frequencies initially unequal, they converge
over several generations
(3) dioecious organisms
sexes separate
HWE produced by random mating of individuals
expand (p2
'AA' + 2pq 'AB' + q2
'BB')2 :
nine possible mating types among genotypes
selfing (self-fertilization)
remains possible
Genotype proportions in natural
populations can be tested for HWE
Ho
(null hypothesis):
no other phenomena acting
Note: HWE often
called a HW equilibrium, BUT
HWE observed only at timeo
of any single generation
changes bx newborns & adults due to other
factors
HWE
may be observed at time1 with
new p" and q"
=> HWE
not an "equilibrium"
Among Euro-Americans:
|
|
|
|
|
|
|
|
|
|
f(M) = [(2)(1787) + 3039] / (2)(6129) = 0.539
f(N) = [(2)(1303) + 3039] / (2)(6129) = 0.461 = 1.0 - 0.539
| N
genotypes |
|
|
|
|
|
|
|
|
p2N |
|
|
|
|
|
|
|
2pqN |
|
|
|
|
|
|
|
q2N |
|
|
|
|
|
|
|
6129 | 6129 |
|
|
|
|
|
|
|
|
|
|
|
|
|
|
|
|
|
|
|
|
|
|
|
|
|
|
|
|
|
|
|
|
|
|
Chi-square test on combined data:
|
|
|
|
|
|
|
|
|
|
|
|
|
|
|
|
|
|
|
|
|
|
|
|
|
|
|
*=> A mixture of populations, each of which
conforms to HWE,
will not show expected HW proportions
if allele frequencies differ in the separate
populations.
Wahlund Effect:
Separate
populations treated as one will be deficient
in heterozygotes
(Basis of F statistics &
population structure, later on)
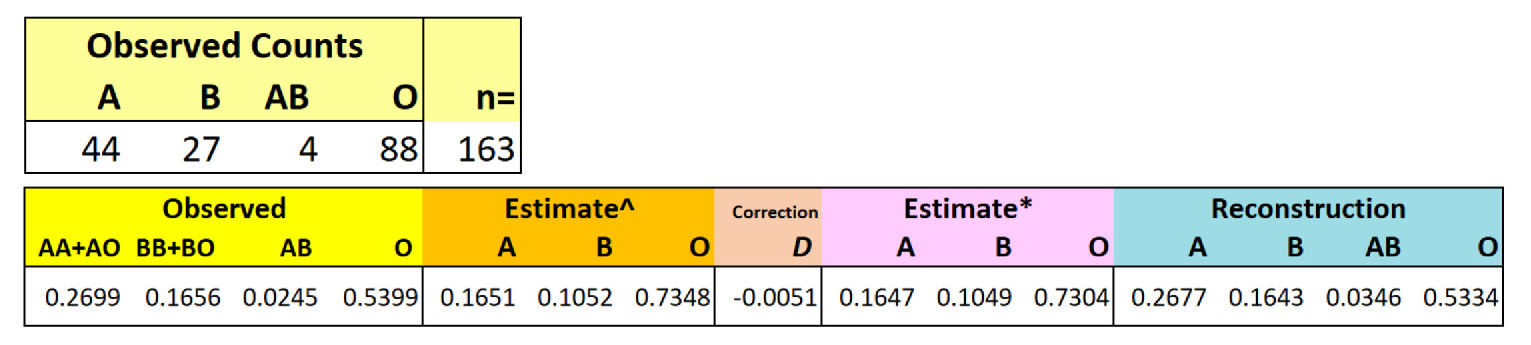
Three alleles (A, B,
O) produce
six genotypes
(AA, AO, BB, BO, AB, OO)
with
four phenotypes ("A",
"B", "AB" "O")
A & B
dominant to O; "A" = AA +
AO; "B" = BB + BO
A &
B" co-dominant as "AB"
Challenge: Cannot obtain exact
algebraic solution for four phenotypes from three
variables
Therefore use Likelihood method with
correction
Ex.:
Best a priori likelihood estimate of f(O)
is observed ![]() [f("O")]
[f("O")]
Data from Aka (Mbenga) (Central
African Republic) (Cavalli-Sforza & Bodmer 1971)
Hardy-Weinberg Expectation offers 'null
hypothesis':
Consequences of other genetic / evolutionary phenomena?
Five major, interacting factors:
1. Natural selection
Change
of
allele frequencies ( q)
[read 'delta q']
q)
[read 'delta q']
occurs
due
to differential effects of alleles on 'fitness'
Consequences
depend
on dominance of fitness
[See hardy-weinberg.m
MATLAB laboratory exercise]
Natural
Selection
is the principle concern of micro-evolutionary theory
2. Mutation
New alleles arise at some rate µ
If µ(A![]() A')
A') ![]() µ'(A
µ'(A![]() A'), net change in frequency
A'), net change in frequency
3. Gene flow
Movement of alleles between populations at some rate m
(Im)migration
introduces new alleles, changes frequency of existing
allele
4. Statistical sampling error
Chance
fluctuations occur in finite populations,
especially with small N
Genetic
drift: random change of allele
frequencies
over time and (or) space,
within and (or) among populations
Modification
of N from non-random reproduction:
variable sex ratio, offspring number, population size, etc.
5. Population structure
Inbreeding:
preferential mating of relatives at some rate F
Inbreeding modifies genotype proportions
but not allele frequencies
Assortative
Mating: differential mating of
phenotypes and (or) genotypes
Meta-population structure:
sub-populations differ wrt total
population (F-statistics)