An early observation of Mendelian ratios
Agronomist WJ Spillman (1863 - 1931) is an
unrecognized player in the early history of genetics, as
the first American who discovered experimentally what
would later be called Mendelian ratios. In a 1901 report
"Quantitative
Studies on the Transmission of Parental Characters to
Hybrid Offspring," Spillman described the outcome
of crosses with various strains of wheat that differed
phenotypically. Like Mendel, he described his crosses in
detail, but provided only the ratios of the
various hybrid classes, rather than the actual numbers
as Mendel had done. Further, as summarized by LPV
Johnson (1948) J Hered, pp. 247-252. "[H]e
recognized that the relative proportions of the
phenotypic classes tended to be constant. He did
not see the significance of these proportions clearly
enough to assign fundamental ratios."
[emphasis added]. Johnson concludes, "We must not
claim for Spillman the independent discovery of the
Mendelian laws of heredity; he fell short of that."
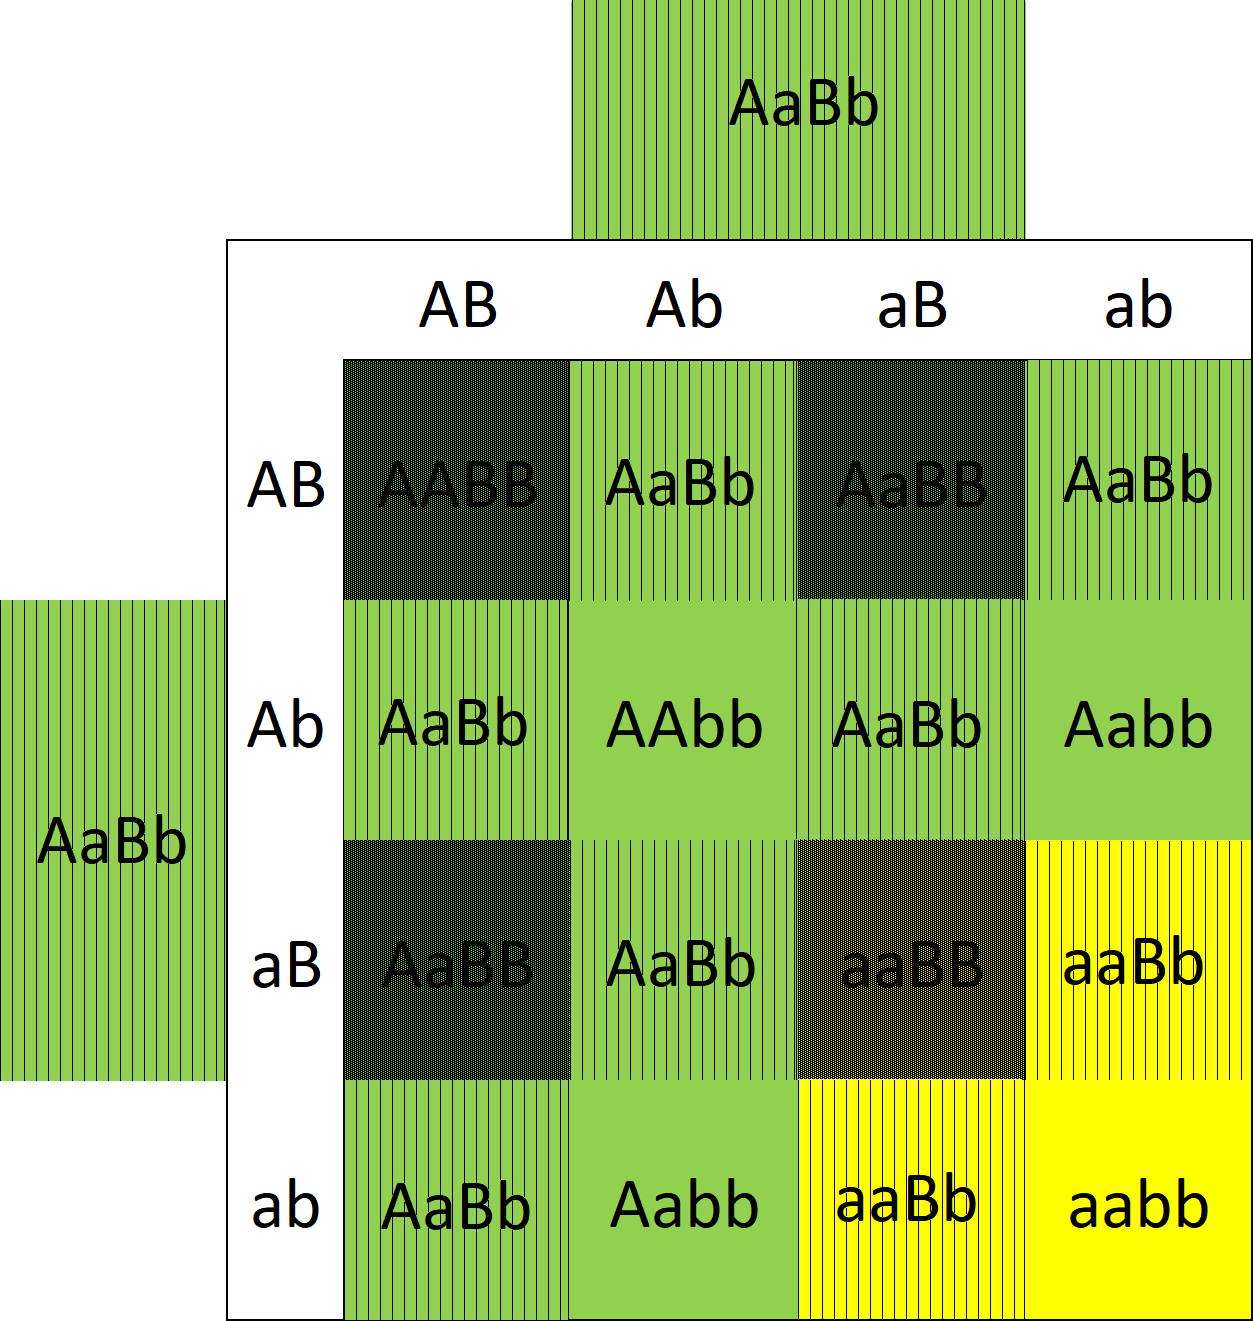
Spillman's crosses provide an interesting but seldom-used teaching example. The Mendelian expectation for a dihybrid cross with two gene loci that each show complete dominance is of course 9:3:3:1. To reconstruct Spillman's experiment, let A be dominant to a at the "A" locus, and B be semi-dominant to b at the "B" locus. Let gene A control color (AA & Aa green, aa yellow) and gene B pattern (BB close-set vertical lines, vs Bb spaced lines, vs bb no lines).
HOMEWORK: Calculate the expected genotypic & phenotypic ratios in the cross shown between AaBb parental plants. Show the calculation. Compare & Contrast with the expected results from a Mendelian cross of two dominant traits.
Figure & Text material © 2025 by Steven M. Carr