Estimation of allele frequencies from genotype
data, with multiple alleles and dominance
Estimation of allele frequencies for a locus with two co-dominant alleles is straightforward from basic algebra and population genetics principles. For example the MN blood system with two alleles M & N and three genotypes MM, MN, and NN corresponding to three phenotypes M, MN, and N.
Estimation of allele frequencies for a locus with multiple alleles & dominance is more complicated. The ABO blood group system is a good example. There are three alleles (A, B, & O) that give rise to six genotypes (AA, AO, BB, BO, OO, & AB) that determine four blood group phenotypes (A, B, AB, & O). Alleles A & B are dominant to O: AA & AO are both type A, and BB & BO are both type B. Population genetic data are typically reported as the observed frequencies or counts of phenotypes, based on the agglutination test. The task is to estimate the allele frequencies from the data, so as to generate the expected frequencies and counts of phenotypes. Observed and expected data can then be compared. However, the ABO system is under-determined: an exact algebraic solution of n variables from n-1 quantities cannot be obtained.
We use instead an approximate solution based on a Likelihood approach, with successive corrections. Likelihood methods use observed data or informed predictions to make or modify an a priori expectation.
Let
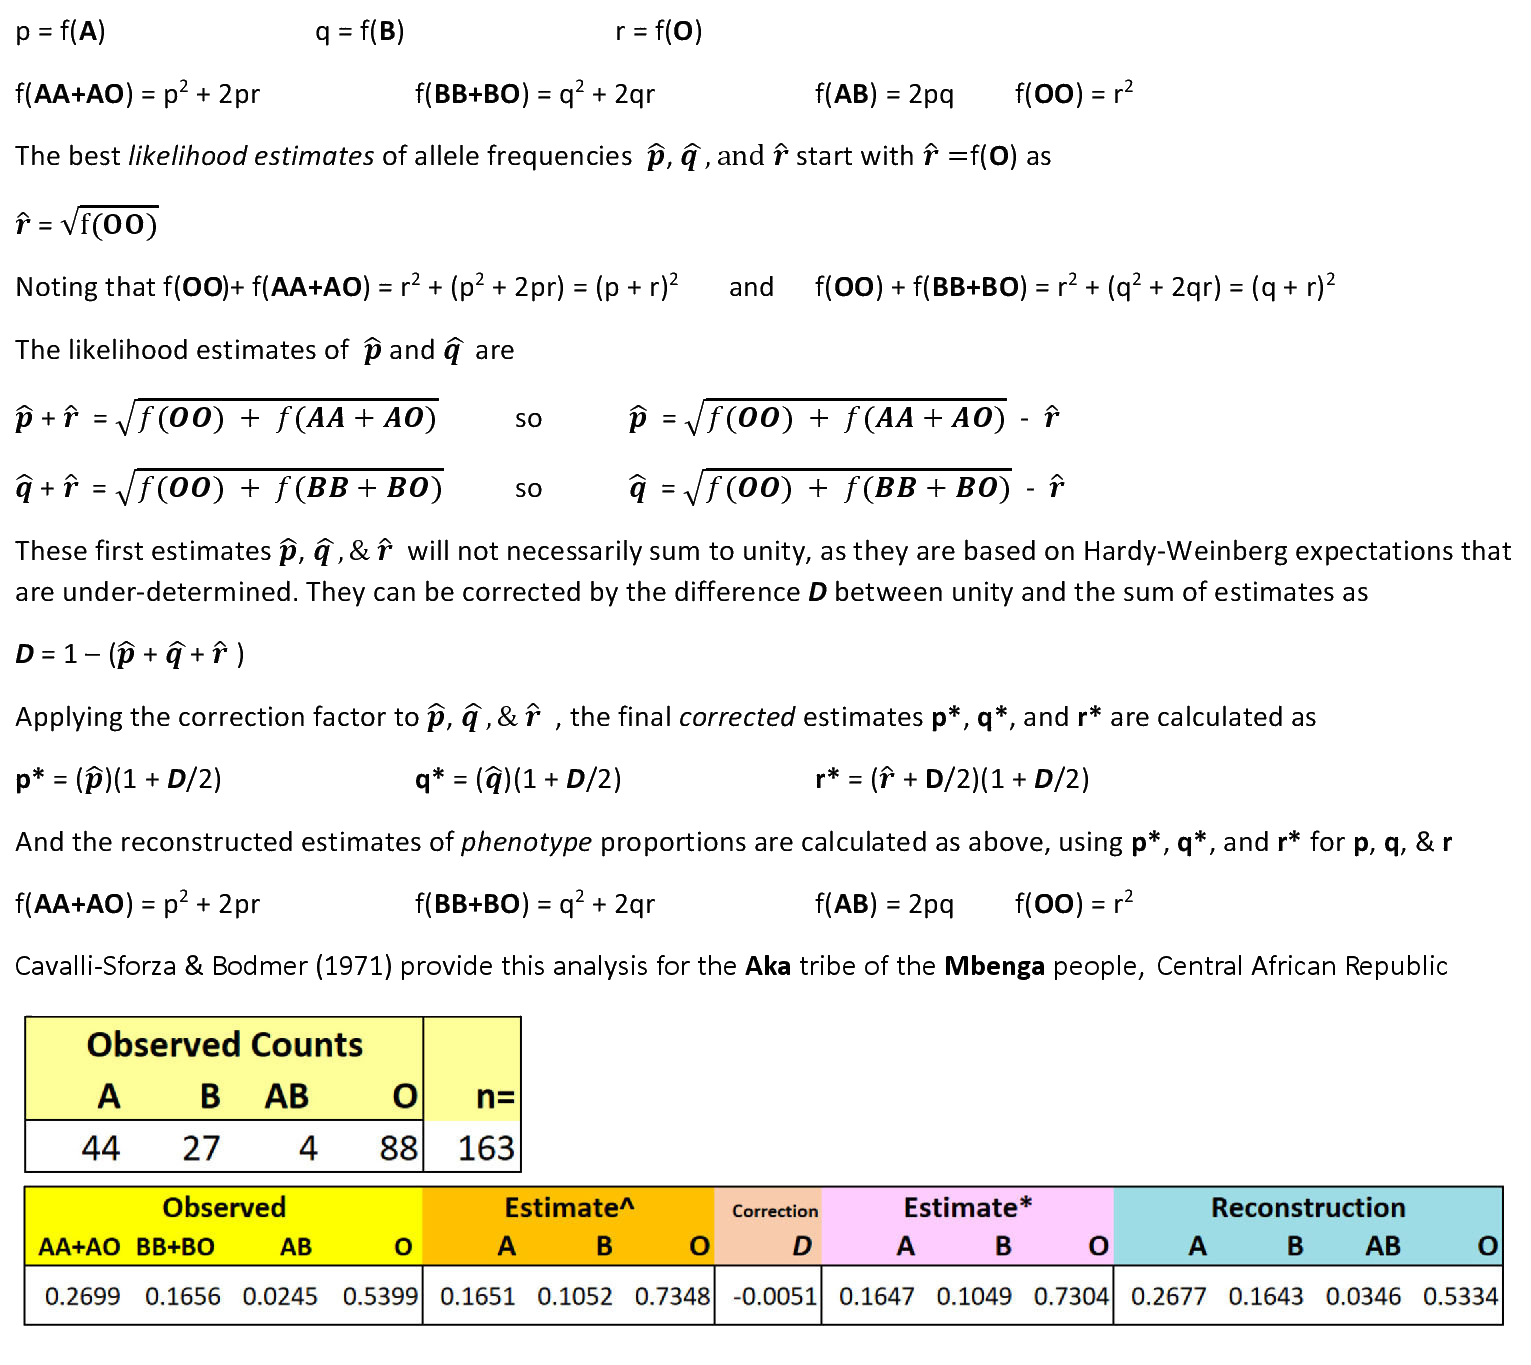
HOMEWORK: Calculate a Chi-Square
analysis of the difference between the Observed vs
Expected ("Reconstructed") counts, based on n
= 163. Does the population show expected Hardy-Weinberg
proportions? Would it makes a difference if n = 1630, with the
same proportions?
Text © 2025
by Steven M Carr