The Chi-Square Test
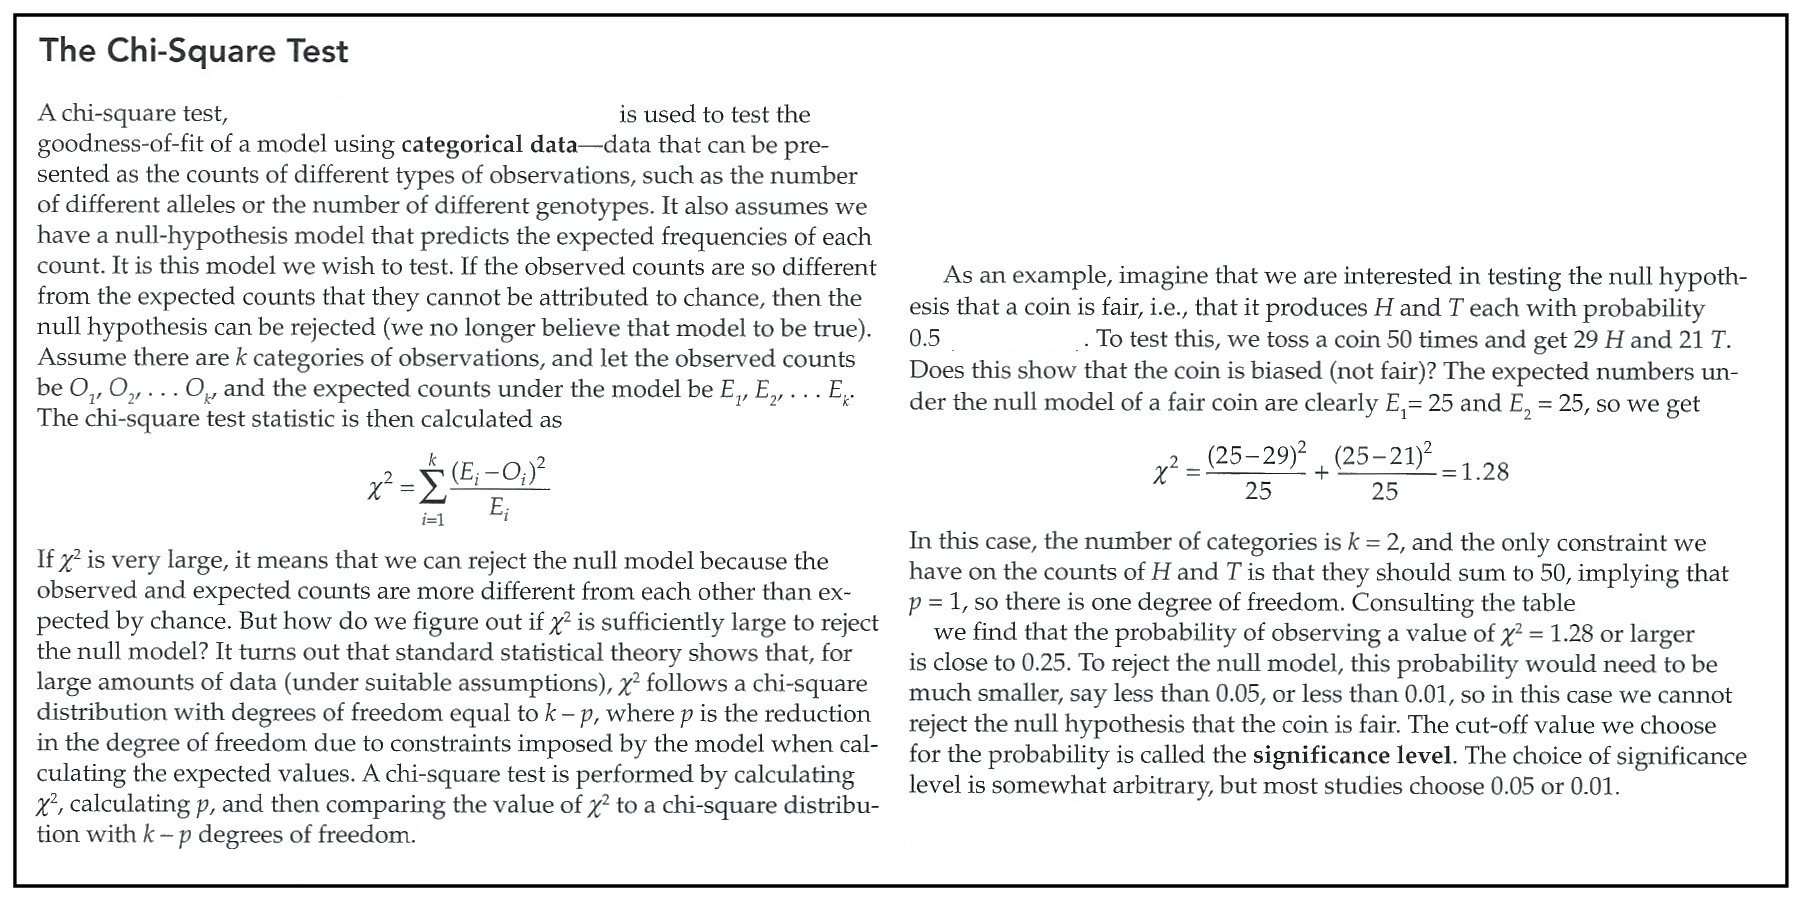
The Chi-Square Test is one of the oldest and
simplest statistical tests of the "goodness of fit"
of experimental data to an expected model. In
combination with discussion of fundamentals,
note in the above especially the concepts of Model,
Categorical (Count) Data, Degrees of
Freedom, & Significance Level.
Consult the Table
of Critical Values for a discussion of
that concept. Chi-Square is now superseded by a
variety of more computationally sophisticated tests,
but remains an excellent model for teaching
fundamentals.
HOMEWORK: The Power of a
statistical test is related to the sample size
necessary to detect what may be a small but
significant deviation from expectation. The numbers
presented show that with n = 50, an outcome of
29:21 is insufficient to demonstrate a
significant deviation from equality. This begs the
question, what outcome would be significant?
Stated another way, what is the minimum deviation
from expectation that could be detected with a sample
of 50? From the formula above, and given a critical
value of X2 = 3.84, show algebraically
the minimum deviation detectable for this
sample size.
If you are feeling energetic, use Excel to calculate a table of the range of such values over a range of sample sizes 50, 100, 200, 500, and 1000. What does this tell you about the importance of sample size in testing biological hypotheses?
If you are feeling energetic, use Excel to calculate a table of the range of such values over a range of sample sizes 50, 100, 200, 500, and 1000. What does this tell you about the importance of sample size in testing biological hypotheses?
Customization of the Chi-Square Test for Nucleotide data
Box after © 2013 Sinauer Associates; Text material © 2025 by Steven M. Carr