Sample Bio4250 midterm questions, from 2021.
The question set may include numerical calculations from data other than that given. I may require an answer to one question in particular, with a choice of any two others.
BIOL4250 - Midterm Questions for exam on 2021
October 28
Prepare answers to ALL of
the HOMEWORK questions below. For the exam, I will choose
FOUR: you must answer any THREE in the exam Period. Show
your work.
[I
suggest that you not use calculators]
1.
Prior
to the advent of molecular data in the 1960s, it was assumed
that the large organismal differences between humans
relative to chimps and gorillas were due to a
large amount of genetic change along the human lineage. Test
this hypothesis by
counting the number of SNP changes between the three
pairwise combinations of Homo
sapiens, Pan troglodytes, and Gorilla gorilla. Report these
numbers: do the data support or reject the hypothesis?
Explain.
2.
William J
Spillman was an
American agronomist who in 1901 independently observed
experimentally what would later be called Mendelian ratios. Answer the HOMEWORK question here
on his crosses.
3.
We showed in
class that with n = 50, a ratio of 29:21 is
insufficient to demonstrate a significant deviation from an
expected 25:25 ratio. With n=50, what is the
minimum deviation from expectation that could be
detected as statistically significant? From the
formula for Chi-Square, and given a critical value
of X2 = 3.84, show algebraically
what that minimum deviation is.
4.
Calculate Hexp for a locus
with 10 alleles at equal frequency: show your work.
How many genotypes are there at such a locus? Answer
the same questions, for 100 alleles at equal
frequency.
5.
Repeat the
derivation of the Hardy-Weinberg Theorem in
terms of ![]() p = (p' -
p).
p = (p' -
p).
6.
Demonstrate
that the curves for positive directional
selection can be obtained from appropriate values
entered in the GSM model in Excel.
7.
For each of
the four graphs, identify which mode of
selection is acting on allele B, where q = f(B).
Explain the features of q over time that allow
you to recognize the mode of selection.
8.
Observe that
the fitness
curves for dominant and recessive alleles have the
same shape, that is, if the green curve is flipped across the
red curve, and flipped again along its length? Explain why.
9.
For a
semi-dominant phenotype with Additive or Genic selection, for an
initial f(A) < 0.01 and s < 0.5, use the GSM
worksheet in Excel to run the (1) Additive and (2) Genic
selection schemes in the table provided. At what values do the
curves deviate and (or) converge on each other? Why?
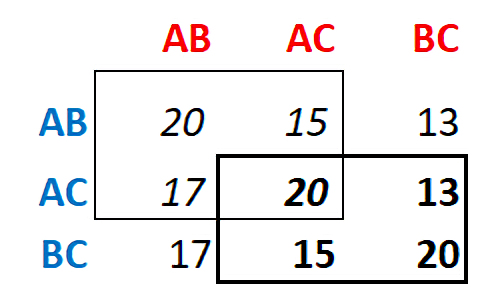
10. Professor Blue's midterm will have
three questions, hardest (A), hard (B), and easy
(C). She will ask any two of them. Student Red decides
they can study for any two, but not all three. The student
will get 10 points for a prepared answer, but only 3,
5, & 7 for unprepared answers to A,
B, & C respectively. For the two 2x2
games in italics [upper left] or bold
[lower right] below, calculate the optimal mixed
strategies for Blue and Red, where matrix
values are payoffs (test scores) to Red. Calculate the Value
of the game to Red.
BONUS: the matrix implicitly includes six other
2x2 games: what are they? Based on basic
principles of game theory, why do none require mixed
strategy solutions?