Change in mean population fitness (![]() ) under
three models of Dominance of Fitness
) under
three models of Dominance of Fitness
Dominance, Additive,
and Recessive models
proceed as in SR2019
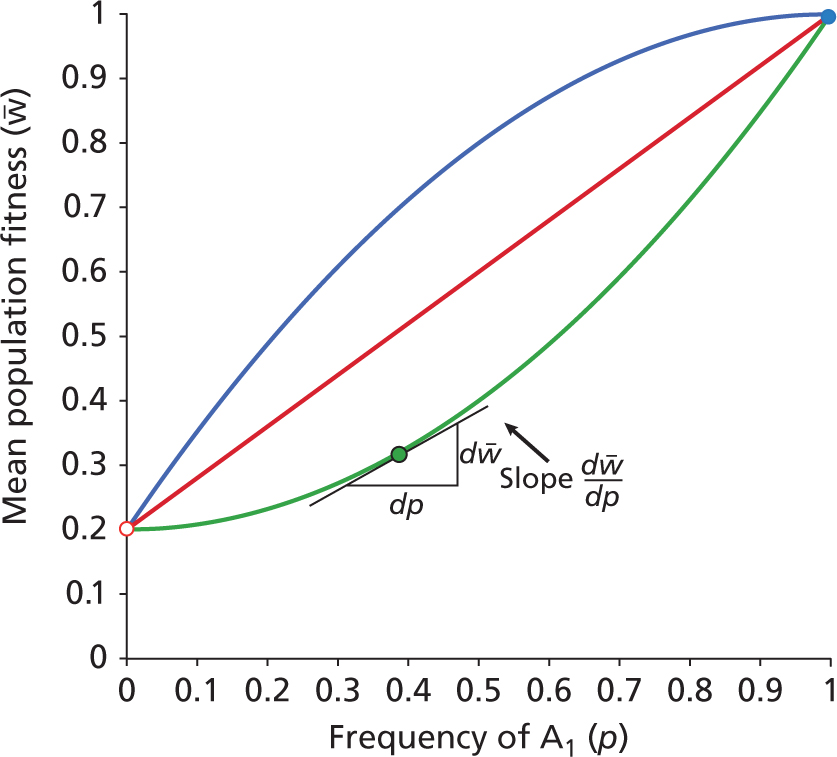
4.1. The three
curves show the mean population
fitness (![]() ) for the three models, as f(A1)
) for the three models, as f(A1)
![]() 1, and
A1
is associated with the more fit phenotypes.
1, and
A1
is associated with the more fit phenotypes.
The slope of the
fitness curve is always positive, however the first
derivative (d W/d p)
shows how the change
in the slope varies as f(A1)
![]() 1.
In the dominance model,
the slope is initially rapid and then decreases.
In the additive model,
slope is constant. In
the recessive model,
the slope is initially slow and then increases.
The consequence of the contrast is seen in SR2019 4.3.
1.
In the dominance model,
the slope is initially rapid and then decreases.
In the additive model,
slope is constant. In
the recessive model,
the slope is initially slow and then increases.
The consequence of the contrast is seen in SR2019 4.3.
[Note: Sætre & Ravinet typically discuss allele frequency change in terms of p, rather than q as is done elsewhere in these course notes. This means their graphs are upside down and backwards wrt my graphs (why?). Be sure to understand the difference].
HOMEWORK: Observe
that the dominant and recessive curves have the same
shape, that is, if the green curve is flipped
across the red curve, and flipped again along its length?
Why is this ?