Molecular
phylogeny of Homo and other Primates
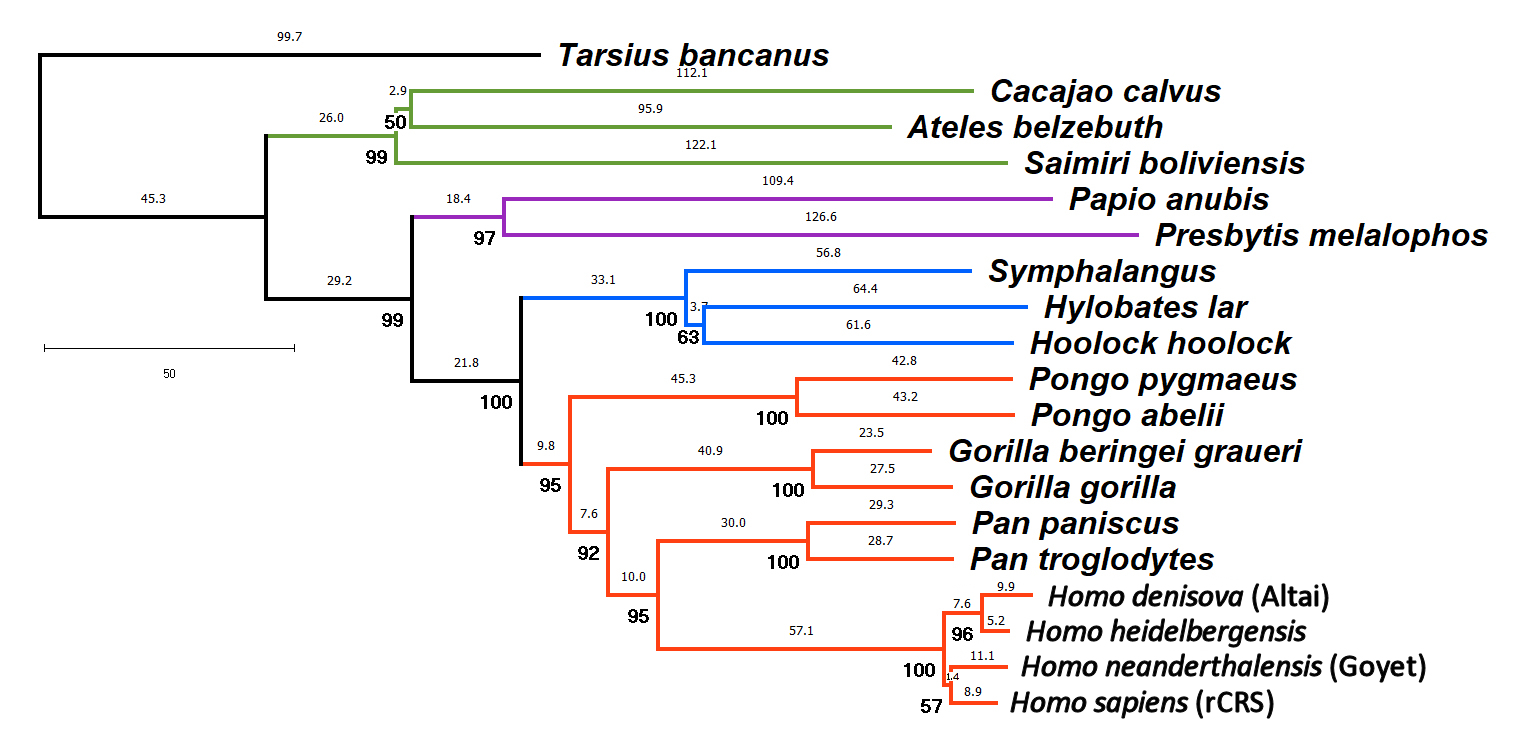
All members of the order Primata are characterized by a distinctive skull feature, a complete bony ring around the eye orbits that facilitates binocular vision. The diagram shows the relationships of modern and extinct species of Homo to other living primates, as inferred from the 13 protein-coding genes (~ 12 Kbp) of the mitochondrial DNA (mtDNA) genome.
The evolutionary tree shows the evolutionary relationships of
humans (genus Homo)
relative to the other Great Apes,
the Great Apes relative to the Lesser
Apes, Apes relative to the Old World Monkeys, the
separation of Old and New World
Monkeys, and the relationships of "Simian"
or "monkey-like" primates to Pro-Simian
tarsiers. Another pro-simian group is the Lemurs (not
shown).
In
such trees, degree of evolutionary relationship is
determined by tracing the branching order
back to the Most Recent Common Ancestor (MRCA)
of any group relative to another. Organisms that share a more
recent MRCA are more closely related. The degree
of evolutionary similarity is determined by
counting the number of base changes (Single
Nucleotide Polymorphisms, or 'SNPs') [numbers
above the branches] along the branches connecting any two
species. Among the Great Apes, humans (Homo)
are more closely related to chimps (Pan)
than either is to gorillas (Gorilla) or to
orang-utans (Pongo). It also shows that extinct and
modern human species are far more similar to each
other than are different species of chimps, gorillas, or
orang-utans. [Numbers in bold below the branches indicate
the statistical confidence in the relationship,
calculated in a manner to be discussed].
Homework: Prior to the
advent of molecular data in the 1960s, it was assumed that
the perceived large organismal differences between Humans
and other Great Apes were due to accelerated genetic change
along the human lineage. Organismal and genetic differences
between the 'Ape-like' Chimps, Gorillas, and Orangs
were expected to be relatively minor. Test this
hypothesis by counting & recording the
number of SNP differences between the six pairwise
combinations of Homo sapiens, Pan troglodytes,
Gorilla gorilla, and Pongo pygmaeus. For each
pairwise comparison, count the lengths of all of the
horizontal branches connecting them. For
example, the difference between Homo sapiens and Homo
denisova is 8.9 + 1.4 + 7.6 +
9.9 = 27.5 . Record the results in the bottom
half of a 4 x 4 (Excel) table. Answer the following
questions.
(1) What is the expected result
if the pre-molecular hypothesis is correct? State
this as a hypothesis. Do the data support or
reject the hypothesis? Explain.
(2) Do the data support or reject
the hypothesis that morphologically similar chimps and
gorillas are also more genetically similar to each other
than to humans? Explain
(3) Repeat the calculation for a New
World monkey (Ateles), Old World monkey (Papio),
Lesser Ape (Hylobates), and Neanderthal (Neanderthal).
Are Monkeys (with tails) more similar than Apes (without
tails)
Analysis & text
material © 2026 by Steven M.
Carr