where
lx = probability of survival from
birth to age x (cumulative)
[cf. survivorship =
probability of survival to age x+1 from age x
]
mx = fecundity (# offspring) at age x
L = maximum age (measured in
appropriate units)
Ro ![]() er
at low population density (otherwise limited by logistic equation)
er
at low population density (otherwise limited by logistic equation)
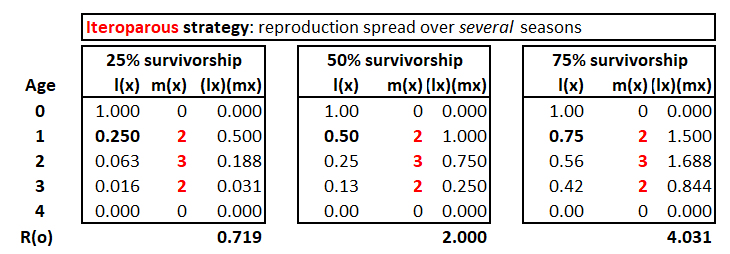
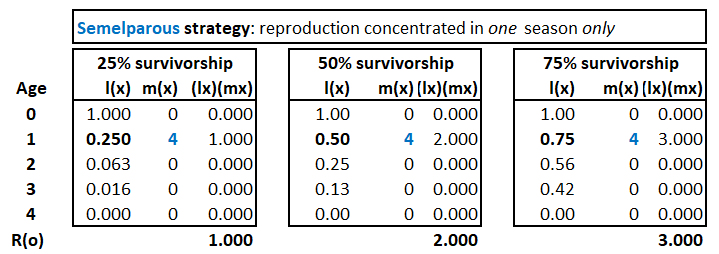
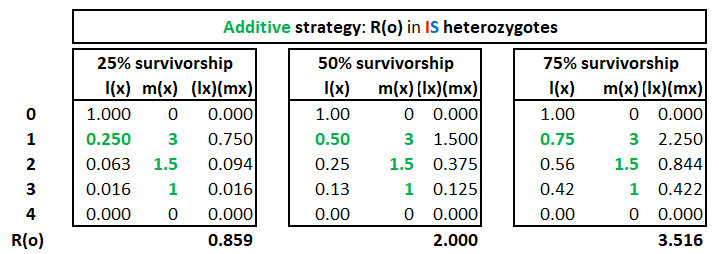
Suppose for some species:
Maximum life
span 4 seasons (days, months, years, etc).
Reproductive
Strategy a genetically determined phenotype:
Iteroparity: reproduction spread out
over several seasons (iterated)
semelparity:
reproduction limited to single season
fecundity for each phenotype determined by genotype
at a single locus with co-dominant alleles I & S
Survivorship
patterns are the same for all phenotypes at any one time:
these
are
determined by the environment
25%, 50%, & 75% in poor, average,
and good environments
[Phenotype is perfectly genetic, AND perfectly environmental]
Experimental
data: Table records # offspring (male &
female) born at each age to each female
Ro = sum over all
age classes
Ro = 2
in population with stable size: each male / female
parent pair produces two offspring
[Blank
worksheet to repeat calculations]
Additive fecundity
in IS heterozygous
mother: average contribution of both alleles
Conclusion
Fitness
differences are measurable as variable Ro
for genetically-determined reproductive strategies
under environmentally-variable survivorship
regimes.
| 25% survivorship |
50% survivorship |
75% survivorship |
|
| Iteroparous (II) |
0.719 |
2.000 |
4.031 |
| Additive (IS) | 0.859 |
2.000 |
3.516 |
| Semelparous
(SS) |
1.000 |
2.000 |
3.000 |
Homework: for the summary
table at bottom, answer the following questions & explain
your answers by numerical examples
1. Can phenotypes be ranked as consistently
more or less "fit" over different environments?
2. Is a population in which one phenotype
is "most fit" necessarily increasing in
population numbers?
3. Is the "least fit"
phenotype necessarily declining in population
numbers?
4. Does a genetically-determined trait
have a constant phenotype in all environments ?