LOD (Logarithm of Odds) score analysis I:
Genetic marker / trait association
LOD score analysis is
used to estimate whether the observed degree of concordance
of a genetic marker with a trait of interest
indicates signification genetic linkage between the
two. LOD analysis is
a basic technique of Genome-Wide
Association Studies (GWAS) used to map traits of interest to
particular chromosomal regions. A full-scale LOD score analysis
requires a fully-mapped genome with many thousands of genetic
markers closely space on all chromosomes, and is complicated
by many factors built into the mathematical model.
As a simple example. consider a trait of interest that is hypothesized to be strongly influenced by a gene region on the X chromosome. To test this, we identify pairs of brothers that share the trait, and ask whether both members of each pair have inherited the same X chromosome markers from their mother..[Assume that all mothers are heterozygous at every marker locus, so that the determination is easy]. At each X locus, the brothers either have the same allele (concordance of the allele with the trait) or alternate alleles (non-concordance). By the hypothesis, markers linked to the gene influencing the trait should show >50% concordance, and those most closely linked should show >>50% concordance.. Alternatively, in the absence of linkage the random expectation is that any particular marker will show 50% concordance., and the overall expectation is (0.5)L where L is the number of loci examined.
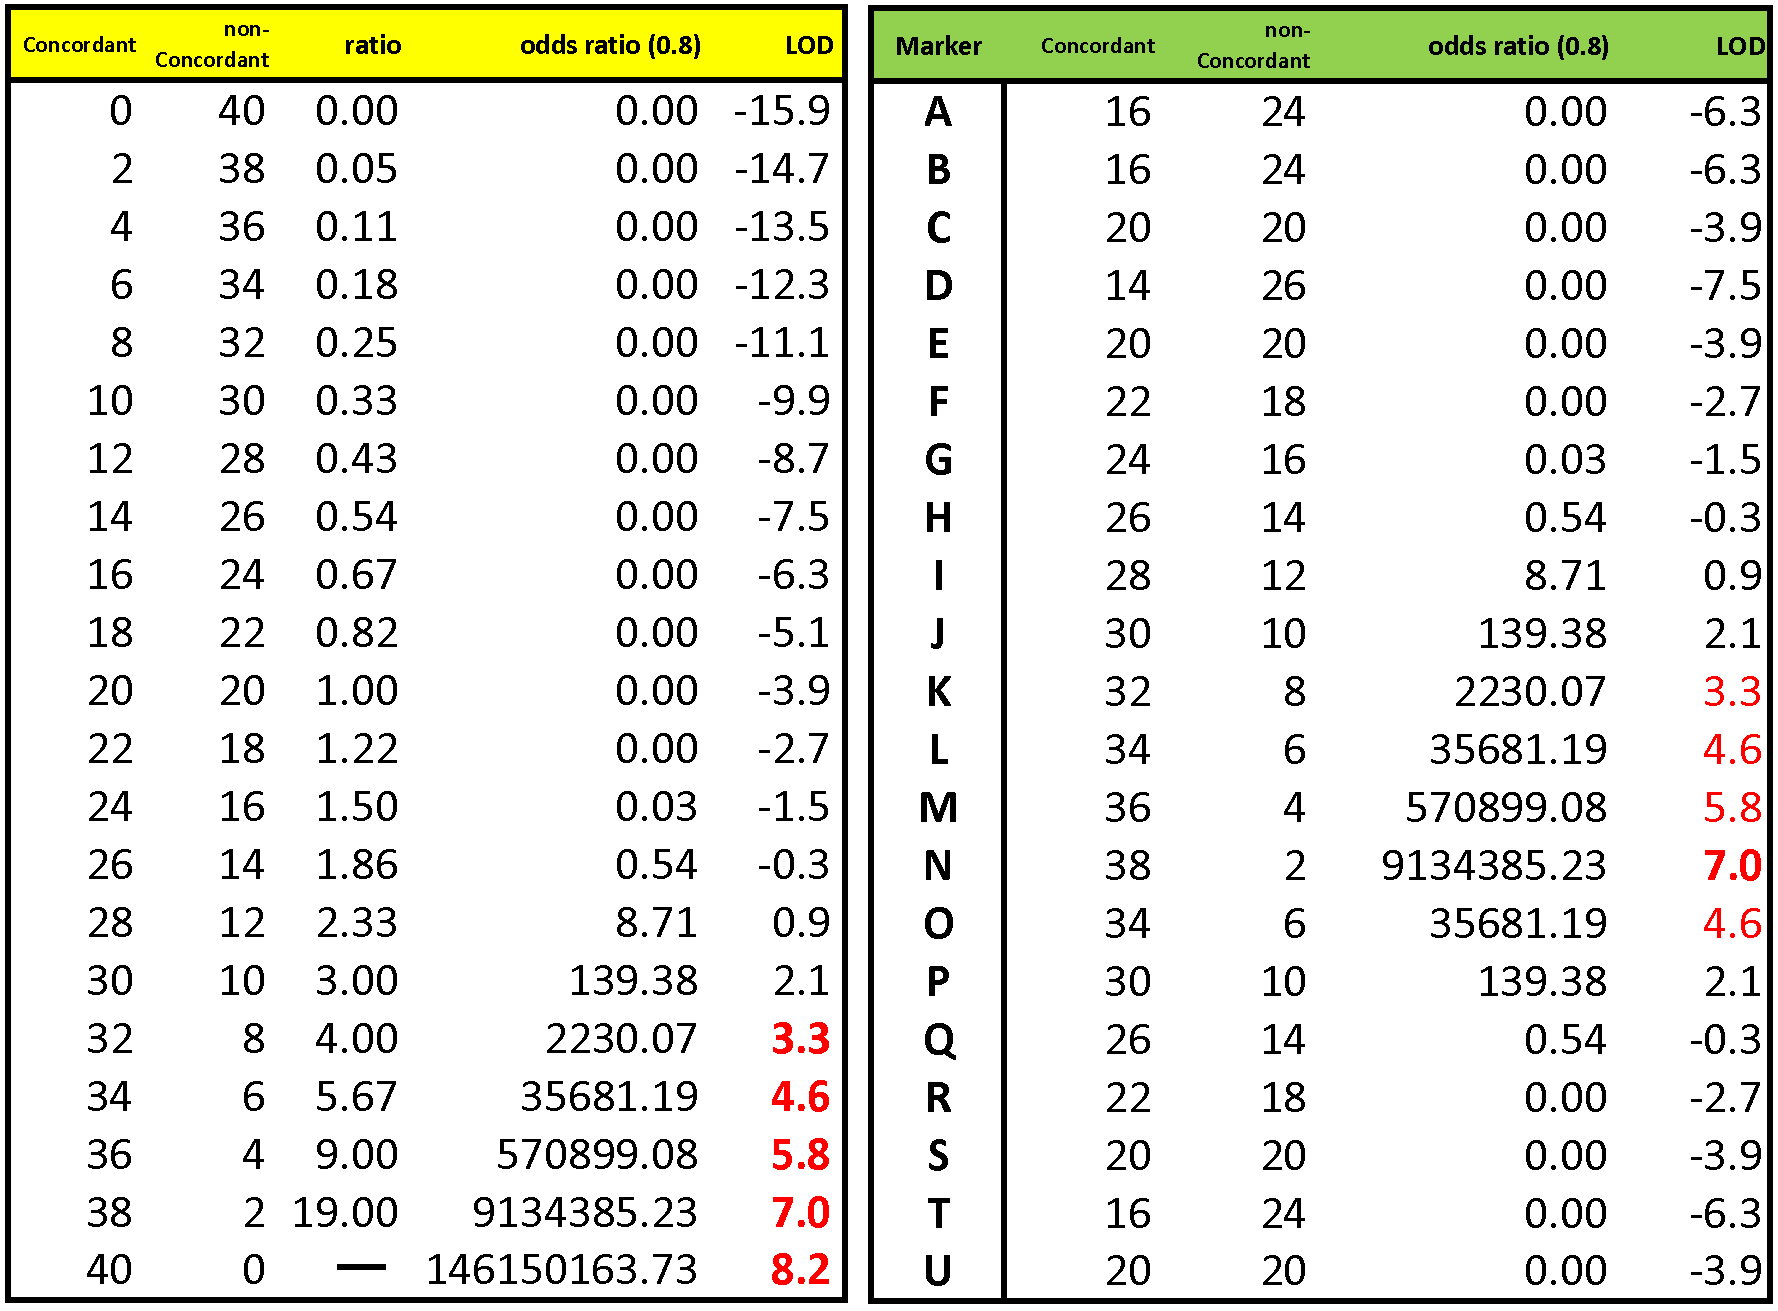
The left-hand table shows the possible outcomes for a study of 40 pairs of brothers. The higher the ratio of concordant to non-concordant pairs, the greater the evidence of linkage. The odds ratio is the probability of obtaining a particular observed concordance ratio, divided by the probability of obtaining that ratio at random. [The concordance probability is also influenced by allele frequencies at the locus, which are set here at a constant θ = 0.8]. Then, the LOD score = log10 (odds ratio). A LOD score of 3 indicates a 1 / 103 chance that the observed concordance is due to chance, which depending on the number of loci examined is often taken as a threshold value.
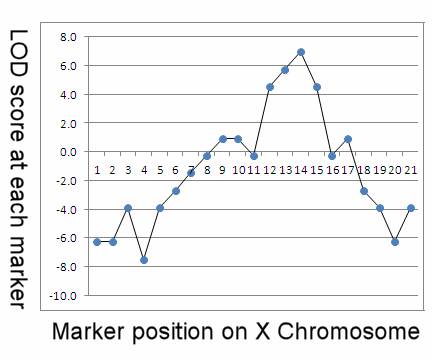
The right-hand table shows a hypothetical experimental result for a series of 21 marker loci (A - U) mapped in linear order to the X chromosome. Each of 40 pairs of brothers are genotyped at each locus and scored as having concordant or discordant alleles. Most markers are ~ 50% concordant, with correspondingly low LOD scores, consistent with random (unlinked) association. However, starting at marker K, trait / marker concordance becomes very high, LOD scores rise rapidly to a peak value at N, then drop off rapidly to random expectation at P (see plot below). This indicates the markers in the region KLMNO are concordant with the trait at LOD >3, which indicates the presence of one or more gene loci in the marked region that influence the phenotypic trait.

Because the positions of the
markers are known, it is now possible to examine that
region around marker N
in greater detail. If the genome has been completely
sequenced, one can look for a candidate gene whose function suggests
that it might be the gene of interest. Where a genome has
been mapped but not fully sequenced, de novo sequencing of the
region of interest may find new genes as candidates for
the gene of interest.