Applications
We have QGIS applications for the first four of our historical layers: 1825, 1846, 1880 and 1903. Each layer can be analysed on its own or across time. For the first three years you can explore in remarkable detail the built environment of Montréal. In addition, 1846, 1880 and 1901-1903 are linked to tax rolls and census returns, while for 1880, the Lovell's city directory is as well. There are currently nine applications available: one for each of the two early layers, five for 1880 and two for the turn of the century.
In 1825, the town had a population of 22,500, by 1903 Montréal had grown to a city of 325,000 people. This rapid change can be analysed in a number of different ways using our maps. Download the applications from this site and run them using the free open-source software QGIS. These QGIS applications are designed to be installed on your own computer, where you can query, analyse, print or modify the maps and even combine layers to make new maps. Click on Q-GIS in the side menu for instructions on how to proceed.
This high degree of interactivity, indeed creativity, are not available with our new web maps. Instead, these maps available via the webmap tab are designed to highlight key research findings: the remarkable importance of landladies in 1903 and the geography of overcrowding. You can also view how the town centre evolved over time, see below, or view videos that explain how to use the turn-of-the century applications, as well as videos of recent research presentations using these applications. Additional aspects of our research infrastructure are available through our collaborations with CIEQ at UQTR, SCHEMA at UQAM and the geography library at McGill.
Adam 1825
Based on Ordnance Survey techniques, this map represents how John Adams, a British Army officer, saw this craft and commercial town of 22,500 people. Demolition of the city walls, completed in 1817, meant the bourgeois town centre had new public squares, broad avenues and numerous building lots. The popular class suburbs, developing organically along their main streets, reach out into the fully settled and prosperous countryside that Montréal served. This map extends west beyond the city's boundaries to show the new Lachine Canal. Stand-alone databases, not yet linked to the map, based on the city directories of 1819 and 1820, the census of 1825, and reconstituted tax rolls for 1825 and 1832 are available from the Database section of this site.
Cane 1846
This commercial map of a town of 45,000 was an integral part of the last great real estate boom prior to industrialisation. A mixture of commodified suburban land and garden estates replaces the farms and market gardens of 1825. A panorama of the densely built city centre is suggestive of the remarkable increases in property values and overcrowding that characterised the city. With this application you can analyse the growing inequality through streetscapes linked to both the 1842 census and the 1848 tax roll, and in the response to the devastating fire of 1852.
Goad 1880
The applications for 1880, discussed below, all build on a rectified edition of Charles E. Goad & Co.'s atlas of 1880 created by MAP.
Montréal's built environment in 1880
This application is based on the Goad atlas of 1880 and shows the built environment by material used: brick or stone, wooden framed or mixed. All entrance ways for carts, as well as porches, are noted. This application includes layers showing the major institutions in the city both by function and religion, as well as the evolution of the private tramway system. As well, the owners of each property are identified.
G80: Property
This information on property owners comes from the municipal tax roll. Property ownership was heavily concentrated among men. Land values varied greatly. Public schools were financed by property taxes, so the religion of property owners mattered. Companies were considered neutral, so their taxes were divided according to the number of students enrolled in each board's schools. A variety of techniques for analysing property ownership are illustrated in the Graphics section of this web site.
Occupants according to the 1880 tax roll
This map links 25,457 residential units to 20,527 male and 2,924 female occupants (1887 units are listed as vacant). Each entry contains their names, occupation and marital status. The map also identifies the 5.177 units where the occupant paid a business tax. Both are shown using a five level classification by annual rental value. People or firms who paid licenses for horses or inns (i.e. taverns) are also individually identified.
Lovell's directory of 1880
This map plots the 34,650 Montréal addresses given by people, firms or institutions in Lovell's city directory. Although many of these people gave both their work and home addresses, most entries are for where people lived. Detailed information on work is frequently given. Lovell's is similar to the tax roll, however, it did not limit entries to heads of household. Hence the importance of density, that is the frequency of entries on a lot. The complete entries for each person or firm can also be analysed using the stand-alone database available for download from the Database section of this site. While the slideshows in the Documentation section and a number of the graphics illustrate various ways this directory information can be used.
Census of 1881
Unlike Lovell's or the tax roll, census returns do not contain street addresses. We have succeeded in linking 111,200 of the 133,000 people in the 1881 census to a specific lot on the map. The massive amount of information contained in the census is presented on this map by gender, by occupational status and for students. The density by lot contrasts nicely with the patterns revealed by Lovell's.
Distribution by census district of the three principal ethnic groups indicate the degree of segregation that now characterized the city. We have included in this application several layers that result from collaboration with other scholars. Brian Young contributed the addresses of those Protestants too poor to pay for their own funeral. Roderick MacLeod and Mary Anne Poutanen contributed the lists of boys and girls attending the Protestant High School of Montreal. These layers revel complexities to the Protestant community not apparent in the district level census data.
Turn of the century
Landlord/tenant relations in 1901.
This application links our database of heads of households in the 1901 census with the landlords and landladies of Montréal in 1903. At the turn of the century, Montréal had the highest rate of tenancy of any city in North America. Fewer than one in fifty households were simple home owners. This application distinguishes between three types of proprietors: simple home owners, rentiers and co-resident proprietors. Rentiers owned their own home in addition to multiple other rental properties. Co-resident owners lived in a duplex or a triplex that they owned, a third of these co-resident proprietors owned additional rental properties, normally in the same neigbourhood. The application allows you to analyse residential properties, other built properties and vacant properties for each of these categories of owners. Women owned a quarter of the rental housing stock and this application permits a detailed examination of their investments.
This linkage is based on a computer-assisted, manual linkage verifying if proprietors lived on a property in 1901 that they owned in 1903. The two years between these sources mean that one should be cautious in the interpretation of the finding that many proprietors, perhaps most, did not live where they owned. Nevertheless, the widely-held belief that in popular class neighbourhoods the landlord lived downstairs is not supported by the evidence. Fewer than one in six tenant households lived in the same building as their landlord or landlady. On the contrary, the evidence suggests property was conceived as an exchange value, rather than a use value. It was a form of investment. Please view the video of our IHAF 2023 presentation for more on this research.
Who Owns Montréal in 1903?
This is a substantially revised application from the one first published in 2021. The earlier edition relied solely on a city publication listig owners, whereas this application integrates additional information from the online 1903 tax roll. This information on where most proprietors lived and their occupations allowed us to distinguish between proprietors who shared the same name. The application details who owned each of the 29,985 lots in the city. Montréal was fast approaching 350,000 residents but only 11,150 people, a third of whom were women, 283 companies, 205 institutions and eight government bodies owned the city. Information taken from the linkage to the 1901 census is included for the first time in this application. The number of known census households on the property and the gender of the household heads are provided for each entry. As well as three indicators of known residence: the address according to the online tax roll, if the tax roll had the owner resident on this property and if the census returns had the owner resident on this property. In addition, the application provides a city-wide analysis of both religious segregation and land values and a fully revised database of the owners. Please view the video of our SSHA 2023 presentation for more on this research.
To your right is a map of the town centre in 1825. You can zoom in by simply clicking on the map. You can also compare this pre-industrial landscape with the town centre in 1846 or 1880 by clicking on the dates below. Like all geo-referenced maps these views have north at the top of the map. For people familiar with Montréal and its idiosyncratic nomenclature, wherein the east-end is actually north and the west-end south of the town centre, this re-orientation of the conventional view may take a little while to get use to.
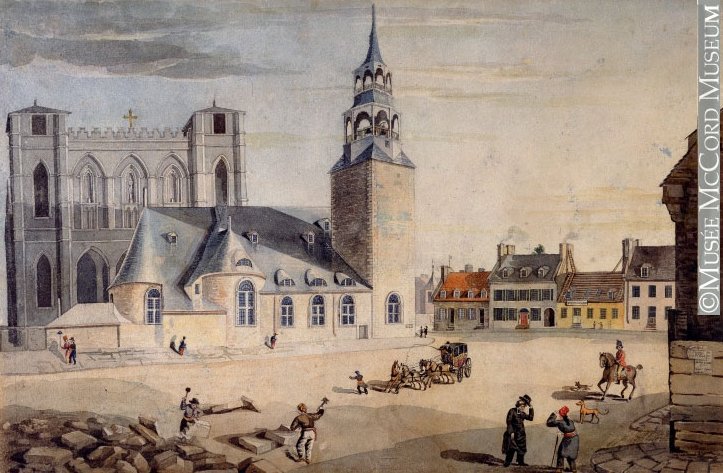
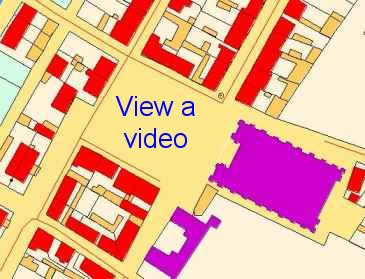
 In 1825, the town centre is still bound by natural limits. The light blue shallows in the St Lawrence limit where and how sailing vessels could approach the modest wharfage in Pointe à Callière. Highly polluted, albeit partially canalized, streams mark the boundaries of the town centre. The gravity fed water supply linked to a small number of hydrants is marked by the red line running along the major and some of the minor streets. John Adams identified three types of buildings, each is colour-coded here: purple is a public building; red is a residence, while outbuildngs are light brown. Vacant lots, many of which would have been gardens or orchards, are coloured light green. A reality check is provided by this water colour of Robert Sproule from 1828, which shows that the old Notre Dame church continued to occupy Place d'Armes years after Adams had left it off the map.
By 1846, the city has double the population and the town centre is much more densely occupied. James Cane did not attempt to classify the types of buildings, but from other sources we know that the West Ward, at the bottom of this map, was an important craft and manufacturing centre, while the East Ward, at the top, was much more residential. Major public institutions were concentrated in Centre Ward, with the exception of the Parliament of Canada located in the former St Anne's Market adjacent to Pointe à Callière.
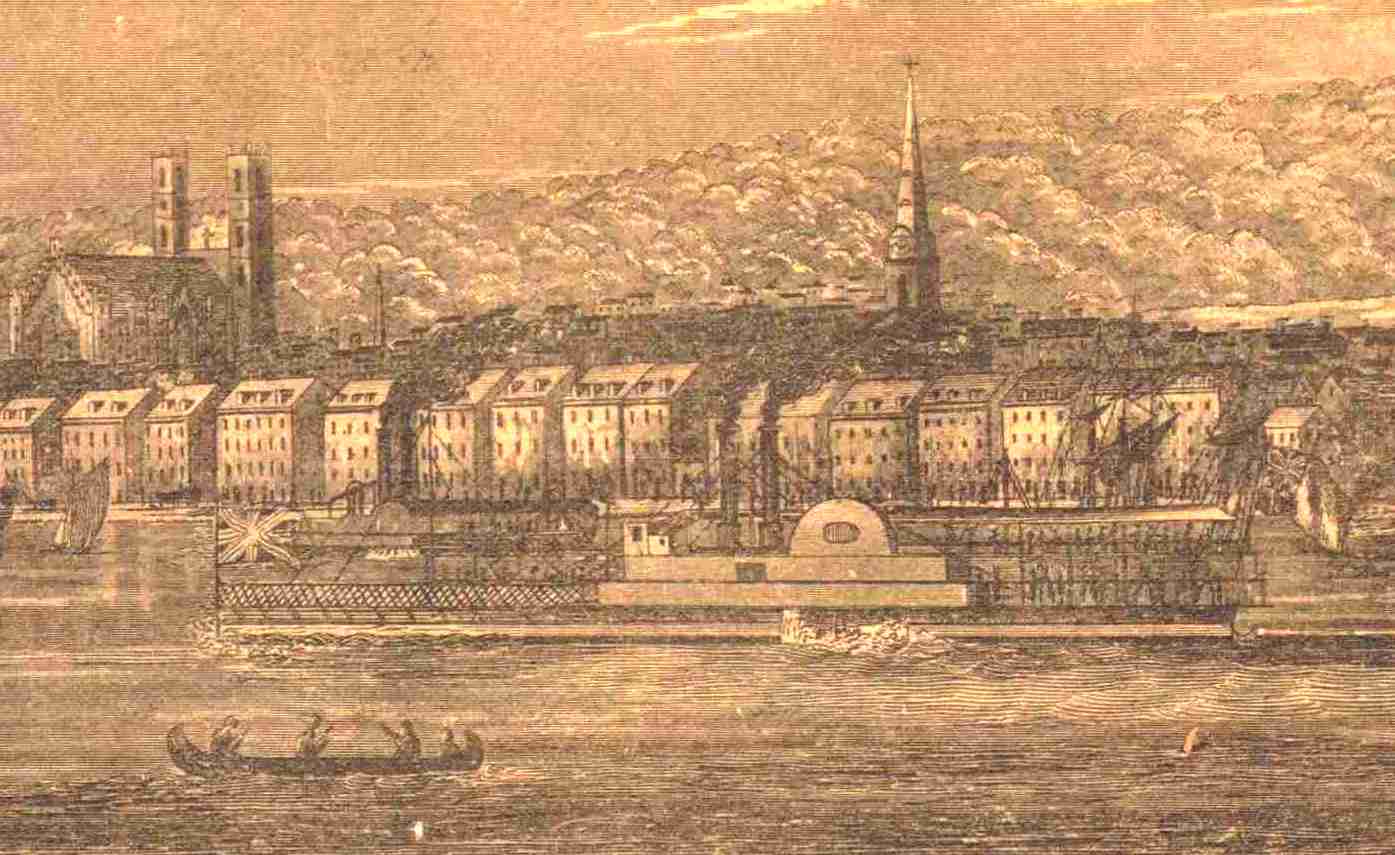
 The environmental limits to urban growth were in the process of being overcome as Cane drew his map. The waterfront was already transformed by miles of wharfage, while the dredging of the harbour and of the St Lawrence River had commenced. Indeed, the exceptionally large vessel visible in this detail from the panorama that adorned the original map was a steam-powered dredger, marking a decisive break with a past represented by a canoe. The streams bounding the city centre had all disappeared into underground brick conduits, while many of the former market gardens and orchards in the suburbs had been subdivided for development.
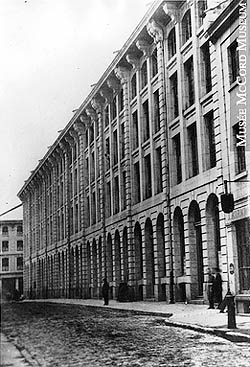
The city centre of 1880 is the industrial, weholesaling and financial capital of the new Dominion of Canada. Space is at a premium and the number of residents in what was now a central business district has declined, while overall the city's population has increased three-fold since the 1840s. A railroad and extensive new quays cut the downtown off from the river. The city centre is now built almost entirely of brick or stone, represented by pink, while wooden frame buildings in light brown are only still in evidence in the surrounding suburban wards. The relatively few hatched buildings are of mixed construction.
 In this view, you can see a layer we created to distinguish the differing types of institutions: churches are purple, other religious buildings are dark purple, government buildings are red, schools are light green, markets are dark green, the army garrison is grey, charities are dark blue, hospitals are grey-blue and leisure facilities are light blue. Symbolic of the changes, two of the three large properties owned by female religious orders, so visible on both Adams and Cane, have been transformed into commercial warehousing and office space.
Download the most recent edition of Q-GIS from their site and follow their instructions for installing it. Now click on Interactive Maps in the side menu to download the files you will need to save to your hard drive. Open QGIS and navigate to the folder where you extracted these downloads. Chose which application to open. Remember if you make any changes to these projects and save on exiting this will replace the original files, so it is best upon opening a project to immediately 'save as' with a slightly different name before doing any major work with these files.
While there is a guide to using Q-GIS available from the consortium's website, the best introduction for historians using Q-GIS is available from the Programming Historian website.
 For a decade starting in 2003, MAP created interactive maps using ArcExplorer, but a code change in Java script in 2015 meant that this free map reader no longer worked properly. We also developed a suite of pedagogical software packages for the 1820s, 1830s and 1880s. Unfortunately, they do not run on 64 bit computers. If you are interested in knowing more about these pioneering efforts in digitial humanities please contact us.
 In 1825, the town centre is still bound by natural limits. The light blue shallows in the St Lawrence limit where and how sailing vessels could approach the modest wharfage in Pointe à Callière. Highly polluted, albeit partially canalized, streams mark the boundaries of the town centre. The gravity fed water supply linked to a small number of hydrants is marked by the red line running along the major and some of the minor streets. John Adams identified three types of buildings, each is colour-coded here: purple is a public building; red is a residence, while outbuildngs are light brown. Vacant lots, many of which would have been gardens or orchards, are coloured light green. A reality check is provided by this water colour of Robert Sproule from 1828, which shows that the old Notre Dame church continued to occupy Place d'Armes years after Adams had left it off the map.
 The environmental limits to urban growth were in the process of being overcome as Cane drew his map. The waterfront was already transformed by miles of wharfage, while the dredging of the harbour and of the St Lawrence River had commenced. Indeed, the exceptionally large vessel visible in this detail from the
  In this view, you can see a layer we created to distinguish the differing types of institutions: churches are purple, other religious buildings are dark purple, government buildings are red, schools are light green, markets are dark green, the army garrison is grey, charities are dark blue, hospitals are grey-blue and leisure facilities are light blue. Symbolic of the changes, two of the three large properties owned by female religious orders, so visible on both Adams and Cane, have been transformed into commercial warehousing and office space.