|
J.W. Bulcock
Purpose I write as an apologist for Canadian schools. Few institutions have changed more in the past 30 years, and few have been subjected to such ubiquitous, sustained, and often vitriolic criticism. Much of the problem can be associated with the weakening of the schools' corporate authority by a judicial system effectively functioning as a quasi-legislative body. Several other factors may be identified. Birth rates in all provinces are well below replacement. In two provinces, Saskatchewan and Newfoundland, provincial populations are in absolute decline. When economic goods are scarce their value is inflated; when fertility ratios decline children become more precious; and when children become more precious parents become increasingly reluctant to "give up" or delegate their authority over children to others -- no matter whether the "others" are the extended family, the schools, or the local neighbourhood. In terms of schooling this reluctance to delegate authority has undermined the principle of in loco parentis -- the principle giving the schools the right to act in the place of a wise and judicious parent. Yet, it is this principle which is at the bedrock of the school's authority. We know that this is the case because parents have challenged the authority of the schools in court. Sometimes the challenge has been over seemingly trivial matters such as dress codes and hair length; sometimes over more important questions such as school prayer, freedom of speech, and the use of coercive punishment. No matter what, the subsequent legal precedents have placed substantial constraints over the corporate authority of schools. The traditional authority vested in the extended family has also declined largely due to the atrophying of the extended family in a highly mobile society. By the same token neighbourhood authority is also in decline thanks to developments in transportation which permit residences to be separated from the workplace. In any case neighbourhood authority was dependent on the informal networks and common understandings among mothers, most of whom are now in the workforce. It should come as no surprise, therefore, that the pre-1960s social contracts between parents and the school authority have been systematically undermined. And it follows that the former balance of authority has tipped so as to be more in favour of the child. As the authority of the schools has declined, the power of the child has increased. In this sense the student movements of the late 60s and early 70s in Europe and America were truly revolutionary. The consequences of these shocks to the corporate authority of
the schools account for much of the recent criticism -- especially criticism
related to presumed declines in moral and academic standards. As
an apologist, however, I claim that there is no systematic body of evidence
supporting a position that academic standards in the ten Canadian education
systems have declined; and I intend to show, despite the conventional wisdom
to the contrary, that Canada's educational system is world class.
First, I draw attention to the fact that a report card cannot be interpreted
unless there exists a frame of reference for the interpretation.
Second I draw attention to the serious misperception of Canada's constitutional
framework within which the schools operate. Third, I reiterate the
views of others regarding the overriding importance of human capital investments
in national income growth accounting. Fourth, I come to the gist of my
argument; namely, that in the core subjects of science, mathematics, and
reading literacy, cross-national studies of school achievement demonstrate
that Canada is one of the world's highest achieving nations. In the
concluding section some modest suggestions are made for promoting greater
uniformity in education quality across Canada's ten educational jurisdictions.
Frames of Reference If your daughter, Shannon, came home and told you that her grade four teacher had given her 27 on a reading test your response might be something like "What does 27 mean?" or "Is that a good mark or a poor mark?" Before a score of 27 can have a meaning it must have a referent. Schools use several different frames of reference for giving test scores meaning, but the commonest one, and by far the most controversial, is the normative frame of reference. In Shannon's case this might consist of the other students in her class. A test score is given meaning by comparing it to the scores of other students taking the same test. Despite the controversy about using norm-referenced teacher-made tests -- they can depress student self-esteem and confidence, hence can have negative influences on student motivational behaviour -- they are still the most commonly used referents on report cards, probably because they are the easiest for parents to understand. Because our goal is to construct a report card for assessing Canadian public education our referent will be the performance of children of the same age and grade in other countries on the same test. For example, by itself, to say that Canadian 10 year-olds on average scored 13.7 on an international test of science achievement is meaningless. A norm referenced meaning would involve finding the mean scores of comparable, representative national samples of 10 year-olds from other countries. And this is what the International Association for the Evaluation of Educational Achievement (IEA) does in all its studies, and what it did in the second international study of science achievement published in 1988.1 The IEA steering committees usually test at more than one age or grade level. At the 10 year-old level 15 countries took part, including Canada (all provinces except Saskatchewan); thus, the reference group countries were the other 14 countries participating in the cross national survey. It turned out that Shannon's score of 27 was out of a possible score of 30; i.e., 90 percent. The average score for the class of 25 grade four pupils was 22 or 73 percent; hence, by this yardstick -- the children in Shannon's class in school -- Shannon had performed above average. In the IEA science achievement study, however, Canada's average score was 13.7 out of a possible maximum score of 24; and Canada's position was sixth out of the 15 countries. While this does not seem to be a particularly poor international standing -- marginally above the international median of 13.2 -- neither does it seem to be a particularly good standing; hence, Canadian newspaper editors whose cups seem to be mostly half empty rather than half full, find yet further evidence for the decline in educational standards and a further opportunity for teacher bashing. Canada's School System The Canadian school system as we know it today was structured for governance purposes by the British North American Act of 1867. Prior to the advent of Confederation, Sir John Alexander MacDonald (Sir John A.) was co-premier of the Province of Canada, at first with George-Étienne Cartier, and later, in the early 1860s, with George Brown, editor of the Toronto Globe. Sir John A. was leader of the Liberal-Conservative party and George Brown leader of the Reform Liberal party. By the mid-1860s both parties had joined forces to push for confederation as a common goal. Sir John A. was the least enthusiastic of the two, but according to Bliss (1944:12) once he realized that public sentiment gave him no choice, he joined the bandwagon and "soon led the band."2 One should remember that the mid-1860s were the years of the American
civil war, and that to most informed observers of the day American federalism
was not equal to the task of reconciling North and South because the American
constitution gave all political powers to the states, including all residual
powers, except those explicitly conferred on the federal government.
In short, it seemed to most Canadians that American sovereignty was vested
in the states. The framers of the British North America Act faced
a parallel dilemma -- how to divide governmental powers between the central
government and the proposed new provinces. To avoid the presumed
flaw in the American constitution the Father's of Confederation gave all
political powers including residual power to the central government.
They wanted to ensure the strongest possible federal constitution with
the most important functions of government firmly under the control of
the central governmental body. To be doubly sure of federal supremacy
the federal government was given the power to veto any provincial government
law. The net result was a second tier of government at the provincial
level in charge of what was intended to be only minor governmental powers,
albeit sufficient to protect the language and the religious rights of the
French speaking minority; namely, property rights, civil rights, local
government affairs, and education. The intended consequence was that
to this day Canadians believe that constitutionally, education is the realm
of powerless PTAs, and equally powerless school boards controlled by a
parochially-minded bureaucracy. The irony, of course, is that since
Sir John A's day education has become the single most important element
by far in the national income growth accounting equation -- a matter taken
up next.
The Economics of Schooling Today, it would seem self-evident that economic success in the global economy is a function of productivity and technological innovation. What is less obvious is that it all begins in the classroom.3 Productivity and national income growth are responses to the knowledge, skills and energy of a well-educated, well-remunerated work force.4 It is becoming indisputable that the countries with world class knowledge workers are the countries with world class economies; and to have world class knowledge workers nations have to have world class educational systems. It is helpful to have physical capital, abundant natural resources and a large supply of labour; but the basic resource is none of these. Rather, it is knowledge that comes first, and not knowledge by a few but knowledge by all. For the foreseeable future knowledge would appear to be the bedrock of competitive advantage. In regard to the production of knowledge workers by our universities Arthur May, President of Memorial University, expressed the situation clearly before a Standing Committee on Industry, Science and Technology of the House of Commons. He stated that: You can produce researchers only by doing research and funding research in the universities. This is the only way they are produced.5 And by the same token you can produce knowledge workers by providing
children and youth with quality educational experiences. And to do
this you have to fund the school system and attract able university graduates
to the teaching profession. This is the way knowledge workers are
produced in all countries.
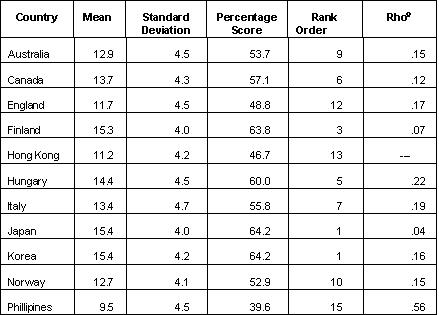
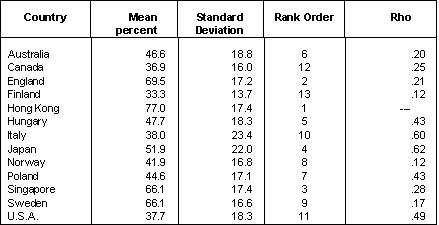
Science Achievement The goal of gathering data on student achievement in the core subjects such as science, mathematics, and reading literacy is a difficult one to attain. It calls for standardized procedures of research, the quantification of assessment variables gathered by instruments which have been translated into many different languages, and in the case of school achievement, consensus among the participating nations over what elements of the curriculum domain to include on the instruments. Canada is a late comer to the international club of nations which since the late 1950s have participated in cross-nations studies of school achievement.6 The procrastination ended in the mid-1980s with the participation of two provinces, British Columbia and Ontario in the second international mathematics study7 and all provinces except Saskatchewan in the second international science study8. From Table 4 one notes that the achievement results for the 10 year-old samples are presented using two kinds of scale -- an ordinal scale for the ranking of nations, and interval scales for the raw scores and percentage scores. Ordinal scales have two mathematical properties: the measurement tells us what class the unit falls into with respect to the property, and it tells us when one unit has more of the property than another unit. The interval scale has both these qualities, but in addition it tells us that one unit differs by a certain amount of the property from another unit. Clearly the interval scale is the superior measurement of the two. But the simpler measurement is the one preferred by the media. In effect the media takes a more accurate measure, degrades it by translating it into an inferior ordinal scale which is the scale it reports. It is simpler to say that Canada came sixth than to say that Canadian 10 year-olds' aggregate score on the international test of science achievement was 13.7 and that the international mean, where country was the unit of analysis, was 13.1. By interpreting the interval scales one notes that the average Canadian 10 year-old scored 13.7 points out of a possible total of 24, or 57 percent; and that the countries with the highest ranking (Japan and South Korea) scored 15.4, or 64 percent. The difference between Canada and the top ranking countries was less than 2 marks out of 24 (i.e., 1.7 marks), or 7 percent. While it is true that in statistical terms the difference between the top ranking countries and Canada on the elementary school mathematics test was statistically significant (in terms of a one-sample t test there was no difference between the international mean and Canada's score, but there was at the p<.001 level for Japan and Korea), in substantive terms few people get overly excited by differences of 7 percentage points on a test. On the other hand, to increase a nation's standard of performance in elementary school science achievement by 7 percentage points might not be easy, although it can be done, as was recently shown in Newfoundland. Table 1
Source: The International Association for the Evaluation of Educational
Achievement, 1988. Science Achievement in Seventeen Countries.
Oxford: Permagon.
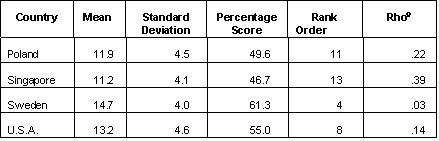
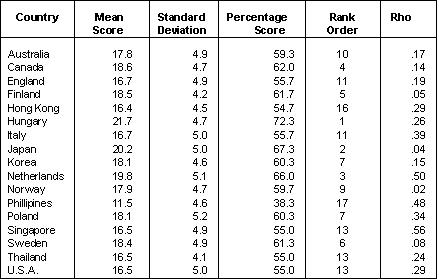
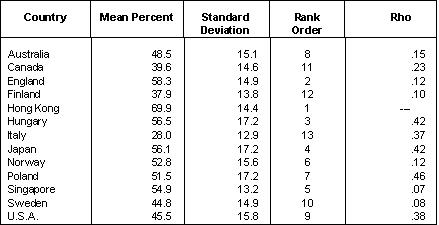
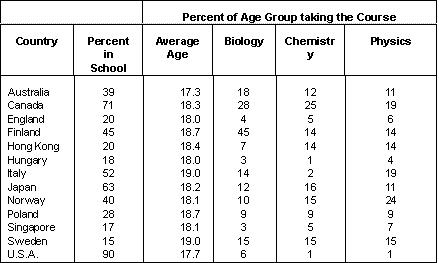
In 1991 Newfoundland's grade 6 standing in mathematics on the Canadian Tests of Basic Skills was measured to be at the 39th percentile -- hardly satisfactory. The Provincial mathematics consultant, Patricia Maxwell, was given the task of trying to improve the situation. She analyzed the test results item by item, compared each item on the CTBS math test battery with the grade 6 curriculum content domain. In other words she found where the students' strengths and weaknesses lay vis-vis the math curriculum. She then passed this information to all the district level math consultants and all the grade six math teachers in the Province along with suggestions regarding how much time might be spent on certain topics, what criterion standards to insist on, and what the teacher expectations should be. Testing occurs every three years, so this year (1994) the grade 6 students were tested again using the same instrument. This time the Provincial standing using national norms was at the 51st percentile, a 12 percentile point improvement.10 The findings for junior high school science achievement (14 year-olds) in 17 countries are presented in Table 2. Their interpretation would be much the same as that for the science achievement of 10 year-olds reported above. It is useful to note, however, that between grades 4 and 9 Canada's international ranking improved from 6th out of 15 countries to 4th out of 17. The finding is revealing because in almost all countries students in the 14 year-old age group are still attending school; hence performance in junior high science is considered a proxy for the scientific literacy level of the adult work force. In contrast, the scores for U.S. students between 4 and 9 declined; a matter which should be of some concern to U.S. educational authorities. Tables 3 through 5 present the rank ordering of countries who tested grade 12 students in their terminal year of secondary schooling in biology, chemistry, and physics. In most of these countries advanced secondary school students take specialist science courses for two years. In raw performance terms the English, Hong Kongese, Japanese and Singaporean students performed well. Countries such as Canada, the Unites States, Italy and Sweden did less well -- quite poorly in fact. Careful interpretation of these results is necessary. Note, first, that there were considerable shifts in national rankings between junior high school performance in Table 2 and senior high school rankings in Tables 3, 4, and 5. In the case of England the change was pronounced, from low ranking (12th out of 15) in junior high school to high ranking (2nd in biology, chemistry and physics) in senior high school. In contrast Canada's ranking fell from high (4th place) in junior high school, to low (11th out of 13 in biology and physics, and 12th out of 13 in chemistry) in senior high school. What is going on here? Before drawing firm conclusion from the statistics presented in Tables 3 through 5 we have to consider age differences, selectivity mechanisms, and participation rates. See Table 6. In Canada over 70 percent of the relevant high school age group, 17-18 year-olds, are still in school compared to 20 percent in England. In the case of biology, 28 percent of the Canadian students are registered while the parallel figure for England is 4 percent. Table 2
Source: International Association for the Evaluation of Educational
Achievement, 1988. Science Achievement in Seventeen Countries.
Oxford: Permagon.
In England, most sixth form students (the equivalent of grades 11 and 12 in Canada) specialize in three "A-level" subjects while most Canadian high school students take 8 different subjects in their grade 11 and 12 high school years. Tables 3, 4 and 5 are comparing the top 28 percent of biology students in Canada with the top 4 percent in England. And similar inequities are to be noted in the cases of chemistry and physics. The fact is that Canada had the highest proportion of its eligible age group taking chemistry of any nation and the second highest proportion taking biology and physics. No country had a higher proportion of its students taking specialized science courses than Canada. Table 3
Source: International Association for the Evaluation of Educational
Achievement, 1988. Science Achievement in Seventeen Countries.
Oxford: Permagon.
Table 4
Table 5
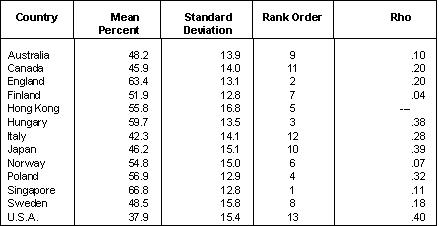
What needs to be done, of course, is to conduct research designed to compare the top 4 percent of sixth form biology students in England with the top 4 percent of Canadian students; and the same in chemistry and physics. While this was not done in the case of the IEA science achievement study, it was done in the case of the 1986, IEA second international mathematics study.14 Here the top 5 percent of Canada's grade 12 students ranked 4th out of 11 countries, and less than one third of a standard deviation behind the second and third ranked countries, Finland and Hungary respectively. It should be noted that tables of specification for selecting test items consist of sets of cognitive objectives that range from low-order factual recall items to higher-order items which call for the use of analysis, synthesis, and evaluative cognitive strategies. What Canadian researchers are failing to do is to compare national levels of achievement on the set of higher-order items in each subject matter domain. Such comparisons would give more valid indicators of Canada's international standing at the grade 12 level than present methods. These analyses are conducted by the national institutes of educational research in several countries; but in Canada no such research institute exists, which is odd because they do in the natural sciences and health sciences. Table 6
Source: Crocker, R.K., 1990. Science Achievement in Canadian Schools.
Ottawa: Economic Council of Canada.
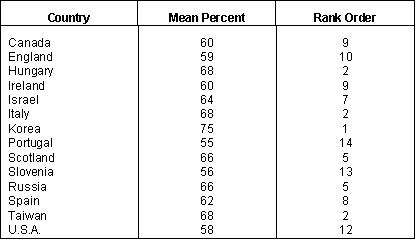
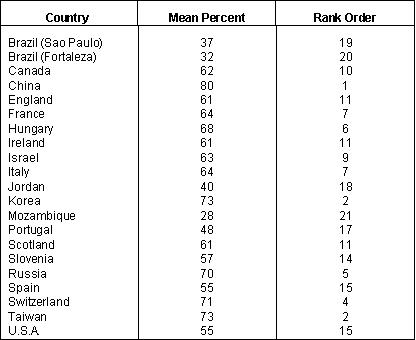
Mathematics Achievement In the 1992 International Assessment of Educational Progress mathematics survey Canadian 9 year-olds came 9th out of 13 countries. Korean 9 year-olds outperformed the rest of the world, but when imprecision of the estimates due to sampling is taken into account there was no statistically significant difference between the aggregate performances of the countries in the second tier (Hungary, Taiwan, Russia, Italy and Scotland). Students from Quebec performed well enough to belong to this second tier of countries. There were 8 percentage points between the aggregate performance of Canadian students and that of the highest performing nation in the second tier. As shown in Table 7 Canada ranked below the half way point in mathematics, but in terms of percentage differences Canada was not all that far behind the leading countries (South Korea excepted). And as we have shown with respect to Newfoundland, a concerted effort by consultants and teachers can sometimes eliminated these performance gaps. Table 7
Source: International Assessment of Educational Progress, 1992.
Learning Mathematics. Princeton: Center for the Assessment of Educational
Progress, Educational Testing Service.
As noted above Junior high school achievement is regarded as a proxy for the educational level of the work force since in almost all countries students are in school until the age of 14. From the data presented in Table 8 it is seen that Canada ranked 10th out of 21 countries, and that the Canadian mean for 13 year-olds was a mere 4 percentage points higher than the international mean. Canada placed in the third tier of countries along with France, Italy, Israel, Scotland, Ireland and England. These countries clustered together, there being no significant difference between their aggregate mean scores which ranged from 61 to 64 percent. Since some of the highest achieving countries were in Asia it is worth noting that Stevenson and Stigler15 suggest that Asian students might be performing at higher levels than North American students in mathematics because Asian teachers work from the concrete to the abstract, the reverse of what teachers tend to do in North America. Thus, fractions emerge from meaningful experience with fractions, not from initial understandings of the abstract concept. They write, "Mathematics ultimately requires abstract representations, but young children understand it more readily if it is embedded in a meaningful context than if it is presented as what seems to be arbitrary definitions and rules." Table 8
Source: International Assessment of Educational Progress, 1992.
Learning Mathematics. Princeton, N.J.: Center for the Assessment
of Educational Progress, Educational Testing Service.
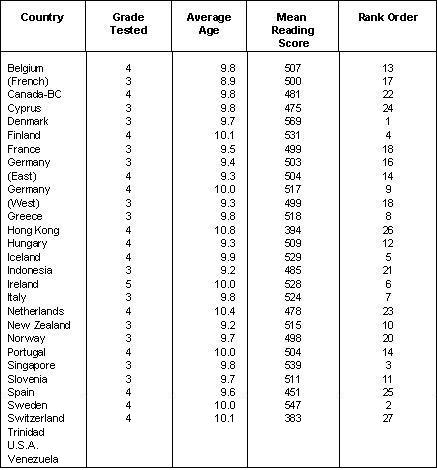
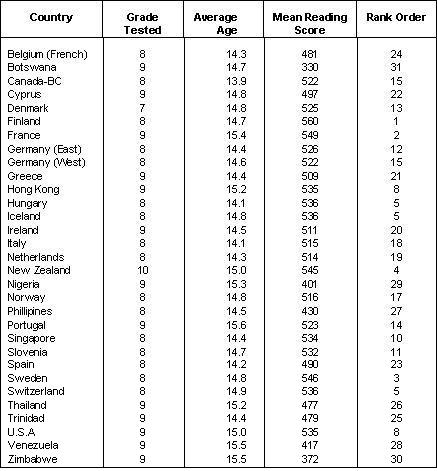
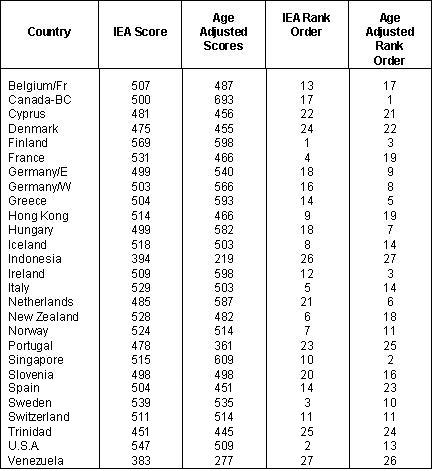
Reading Literacy The International Association for the Evaluation of Educational Achievement released the results of its reading literacy tests in 1992. At the 9 year-old level the standing of Canada-BC (no other province took part) was reported to be 17th out of 27 countries. At the 14 year-old level Canada-BC was ranked 15th out of 31 countries. The statistical results are reported in Tables 9 and 10. Canada's 9 year-olds had a mean score of 500 with a standard deviation of 80. Alpha reliability was 0.93. Note from Table 9 that the mean scores are bunched; thus, there was no significant difference between the scores for Ireland, Greece, Belgium (French), Switzerland and Slovenia. Six nations ahead of the group in which Canada was a member were also bunched together -- Iceland, Singapore, Norway, France, Italy, New Zealand and Sweden -- and, again, the modest differences between them were not statistically significant. With Finland and the United States in the first tier, Canada-BC would fall into the third tier. Because of this bunching together, and because of the modest differences between the countries in each group, it would seem that Canada was holding its own as a third tier country, and that the problem for educators in Canada would be how to lift standards so that Canada could join Finland and the United States in the first tier. Note, however, that the mean ages of the students in all 27 countries were higher than those in Canada, and that this was particularly evident in the cases of countries with higher reading literacy standings than that of Canada. The average ages of the United States, New Zealand, Italy, and France samples were a year or more higher than the average age of the Canada-BC sample. Note, too, that the age question is confounded by the fact that in several northern European countries grade one begins at age 7, whereas in North America and much of the rest of the world grade one begins at age 6. Thus, students in grade 3 in Canada would be the same age as students in grade two in countries such as Denmark, Finland and Iceland. From Table 9 we note that the Canadian sample were on average 8.9 years of age, whereas the mean age by country was 9.7. In the face of this discrepancy, and given that IEA analysts made no adjustments for age, it was decided to adjust the scores for age differences between samples. There were three considerations. First, reading literacy is not a particularly school dependent endeavour. Students well before the age of school entry are exposed to reading demands on a daily basis. Thus, second, children in many countries will already have defined themselves as readers by the age of about six. Third, by the age of ten most children will have experienced four years of schooling, even if not four years of formal reading instruction. Between the ages of 9 and 10 the reading improvement of most children is substantial. This is the age when most children in industrialized countries begin to switch from primary dependence on grapho-phonemic or bottom-up text processing to increasing dependence on syntactic-semantic inferencing, or top-down processing. It is the switch from learning to read to reading to learn. On the basis of these simplifying assumptions the mean scores were interpreted not as fixed points but rather as indicators of reading potential. And on this basis the IEA scores were adjusted for age differences. The adjusted scores are reported in Table 11. Note that the Canadian mean following adjustment shifted from 500 to 693, so that instead of being 15th Table 9
Source: National Center for Educational Statistics, 1993. Digest of Educational Statistics 1993. Washington, D.C.: U.S. Government Printing Office. Table 10
Source: Same as Table 10. Table 11
Canada-BC became 1st. Lest the adjustment is thought to be too
good to be true it should be pointed out that independently of this writer,
the British Columbia research team was replicating the study on a grade
4 sample -- one in which the mean age level corresponded to the mean of
the IEA sample. They found that for this sample the aggregate achievement
level was, indeed, higher than that of Finland, the highest ranking country;
while at the same time the new analysis confirmed the rankings of the adjusted
means results presented in Table 11. Without belabouring the point
it is noted that the same adjustments were made for the 14 year-old sample,
with the result that the Canadian ranking became second, not 17th.
There is evidence from the Statistics Canada Survey of Literacy Skills
Used in Daily Activities that most Canadian Provinces would be unable to
match the reading standards of children in British Columbia. Nevertheless,
the B.C. standard is one that all provinces should aim to attain by the
year 2000.
Conclusions Some of the problems besetting Canadian schools were identified as inevitable consequences of the erosion of the schools' corporate authority. It was argued that as the corporate authority of the schools declined the power of students has increased. A recent Canadian white paper which has suggested the use of educational vouchers as a method of paying the costs of post secondary schooling would seem to be the ultimate enhancement of student power. Although the critics of the schools claim that standards have declined and continue to decline, there is no hard empirical evidence to substantiate their claims. In fact, cross-national studies of educational achievement suggest that Canadian students may be holding their own in terms of international competition. Most of the evidence cited by the critics lacks a referent or comparison group, whereas in the case of international studies of school achievement the referent is the performance of children of the same age in the same school subjects in other countries. Since Confederation, schooling in Canada has been viewed as one of the minor responsibilities of government. It is well known that the father's of Canadian federation delegated what they thought to be minor powers to the provinces, keeping what they thought were the most important matters concerning the economy and trade, foreign affairs and defense in the hands of the national government. But while education was assumed to be a minor power with nothing to do with the economy of the country it has turned out to be the single most important feature of national productivity and income growth. Fortunately, the provinces seem to be handling their educational responsibilities efficiently and effectively. The case of science achievement is impressive on three grounds. First, Canadian students are only marginally behind several leading nations at the elementary school level. There is no reason why performance standards in science achievement could not be enhanced and the current gap closed at this level given consensus about national strategies to be identified later. Secondly, as students move through the school system performance in science improves vis-a-vis the performance of students of the same age in other countries. Compare Tables 1 and 2. Thirdly, while on the surface, the performance of Canadian students in biology, chemistry and physics, during the last year of high school seems weak, on closer examination they are shown to be highly competitive. For example, a higher proportion of Canadian students stay in high school than in most other countries; and a much higher proportion study science subjects than in most other countries. See Table 6. Most important, however, is the fact that the situation is improving. Thus, when the top 5 percent of Canadian students are compared to the top 5 percent in other countries, the Canadian students more often than not come out on top, even when comparisons are made with students in other countries who specialize in only three or four subjects in their last two years of high school. Mathematics achievement in Canada fell behind the parallel achievements in several Asian countries. Nevertheless, Canadian performances were on a par with those in several European nations, whose scores clustered together. At both the elementary and junior high school levels Canadian students fell into the third tier of countries. Within each tier or cluster there were no statistically significant differences in performance. Nevertheless, mathematics achievement is at best satisfactory, and needs to be taken far more seriously by school authorities. In 1992 the International Association for the Evaluation of Educational Achievement released a misleading report about the performance of Canadian students in reading. A retraction is still not forthcoming. The statistics released had not been adjusted for substantial age and grade differences in reading. Canadian grade 3 pupils were being compared invidiously with pupils in grade 4, and in one instance pupils in grade 5. Most of the students in the leading countries were around a year older than the average Canadian student. When adjustments were made for these age-grade discrepancies Canadian students ranked first in reading at the age 9 level and second in reading at the 14 year-old level. From Tables 1 through 5 it is noted that there are substantial amounts of school achievement variance lying between schools. Implicit in this finding is the notion that not all Canadian schools are equal. Provincial governments are beginning to address this problem through a program of research designed to construct accurate educational indicators. There are three other relatively modest ways (in terms of cost) of promoting greater uniformity of educational standards across the nation. First, in nearly all the countries with world class educational systems, there are national curriculums, and in most of these countries four subjects constitute the curriculum core; namely, mother tongue language and literature, mathematics, science and a foreign language (in some countries more than one). Perhaps the day has come to recognize that in terms of national interest not all school subjects are equal, and that it would be educationally sound to promote national standards in these four areas as is proposed by the Council of Ministers of Education, Canada in their School Achievement Indicators Project. Second, most of the high performing school systems have some 190 to 200 instructional days in the school year. In each instructional day, instructional time averages 300 minutes (there is some variance between the early grades and the secondary school grades), giving around 1,000 hours of instructional time per school year. With the notable exceptions of Alberta, Manitoba, and Saskatchewan Canadian school systems fall short of meeting these international standards. In some jurisdictions this might be all that is necessary to bring standards up to the international level. Third, following the recommendations of the Newfoundland Royal Commission on Education, consideration might be given to the introduction of national accreditation procedures both in faculties and colleges of education, and in the nation's high schools. Two expensive but essential initiatives are unlikely to be introduced without substantial Federal support, and both deserve early attention if governments have long term national interests at heart. These are: (i) pre-school education for 4 year-olds, and (ii) a post-secondary scholarship program based on competitive examination in the four core subject areas of schooling identified above. These expensive items would bring Canada up to par with countries such as France, Germany, the Netherlands, and England. The report card entry for Canada might read then as: Canada is performing well in science and reading but mathematics performance is disappointing. Improvement in all three subject areas is expected.
Bliss, Michael. Right Honourable Men. Toronto: Harper Collins, 1994. Crane, D. The Next Canadian Century: Building a Competitive Economy. Toronto: Stoddart Publishing, 1992. Crocker, R.K. Science Achievement in Canadian Schools. Working Paper No. 7. Ottawa: Economic Council of Canada, 1990. Forshay, Arthur and Torsten Husén. The Educational Achievement of Thirteen Year-Olds in Twelve Countries. Hamburg: UNESCO Institute for Education, 1962. Husén, T. The International Study of Achievement in Mathematics: A Comparison of Twelve Countries. Vols. 1 and 2. Uppsala, Sweden: Almquist and Wiksell, 1967. IEA. Science Achievement in Seventeen Countries. Oxford: Pergamon, 1988. Porter, M.E. The Competitive Advantage of Nations. New York: The Free Press, 1990. Robitaille, G.R. & R.A. Garden. Canadian Participation in the Second International Mathematics Study. Ottawa: Economic Council of Canada, 1989. Stevenson, H.W. & J.W. Stigler. The Learning Gap. New York: Summit Books, 1992. NOTES 1. IEA, 1988. Science Achievement in Seventeen Countries. Oxford: Permagon. 2. Michael Bliss, 1994. Right Honourable Men. Toronto: Harper Collins. 3. D. Crane, 1992. The Next Canadian Century:
Building a Competitive Economy.
4. M.E. Porter, 1990. The Competitive Advantage
of Nations. New York: The Free
5. A. May, 1990. Presentation to the Standing Committee
on Industry, Science and
6. See studies by Arthur Foshay and Torsten Husén.
A.W. Foshay (Ed.), 1962. The
7. See Robitaille, D.R. and R.A. Garden, 1989. Canadian
Participation in the Second
8. See Crocker, R.K., 1990. Science Achievement
in Canadian Schools. Working
9. Rho is an intra-class correlation coefficient (Kish,
1987) indicating the extent to
10.
Information in this paragraph is based on personal communication with Ms.
11. Source: Same as Table 1. 12. Source: Same as Table 3. 13. Source: Same as Table 3. 14.
The source of this information was Table 375 in The National Center for
15.
H.W. Stevenson and J.W. Stigler, 1992. The Learning Gap.
New York: Summit
|