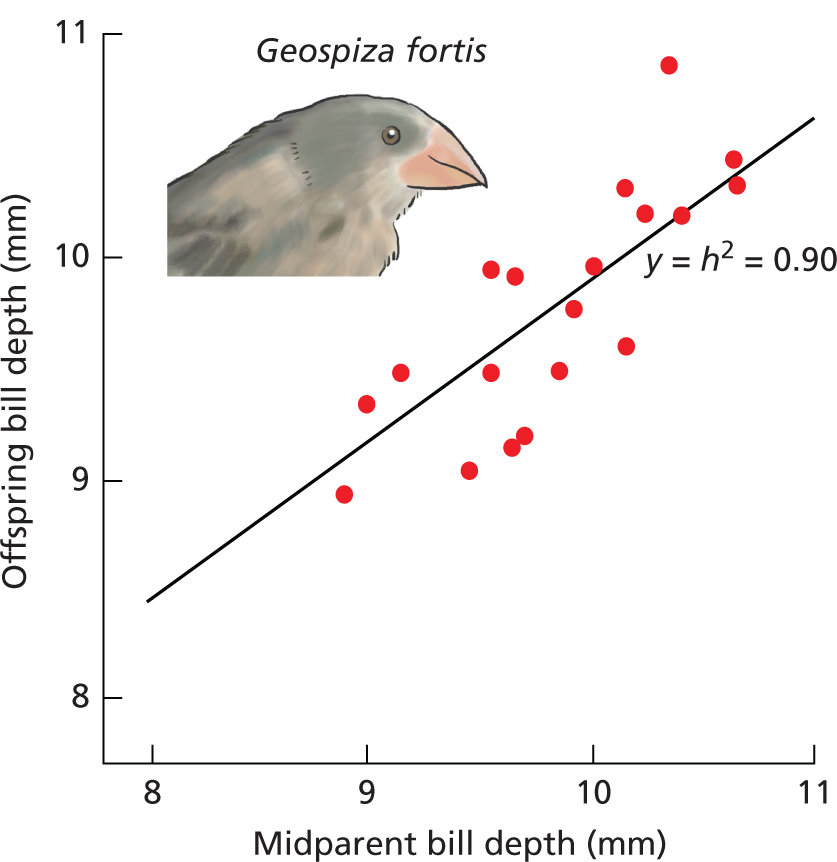
Estimating heritability (h2) from Parent / Offspring correlation
Geospiza
fortis is one of Darwin's finches that is adapted
as a seed cracker. Mechanical force is a function of Bill
Depth, measured from top to bottom of the bill at its
base. The plot shows the relationship between the midparent
value (average of mother & father birds) and the
measurement in their offspring. The statistical
correlation between these two measurements is equivalent
to the slope m of a line of the usual form y = mx
+ b. The y-intercept is zero, so b = 0 and the equation
simplifies to y = mx, where m is the heritability
of the trait. Where h2 = 0.90,
90% of the variance in offspring bill depth can be
explained by variance in the midparent value.
Note that the coefficient here is a correlation (r): there is no assumption that parents "cause" offspring bill depth. The calculation is the same for the coefficient of regression (r2), which regresses a predicted independent variable on a predictive dependent variable. This might be the case if you wanted to argue that parents do in fact "cause" the trait in their offspring, because it is determined by their genetics. In most field studies of this sort, regression analysis is inappropriate, in part because the midparent values are not 'chosen' but merely sampled from the population (technically, the midparent value is measured with error). There is also a temptation to use the coefficient that has a larger numerical value: here, where r = 0.90, then r2 = 0.81.
Note that the coefficient here is a correlation (r): there is no assumption that parents "cause" offspring bill depth. The calculation is the same for the coefficient of regression (r2), which regresses a predicted independent variable on a predictive dependent variable. This might be the case if you wanted to argue that parents do in fact "cause" the trait in their offspring, because it is determined by their genetics. In most field studies of this sort, regression analysis is inappropriate, in part because the midparent values are not 'chosen' but merely sampled from the population (technically, the midparent value is measured with error). There is also a temptation to use the coefficient that has a larger numerical value: here, where r = 0.90, then r2 = 0.81.