The Site Frequency Spectrum (SFS) and Folded SFS
Calculation
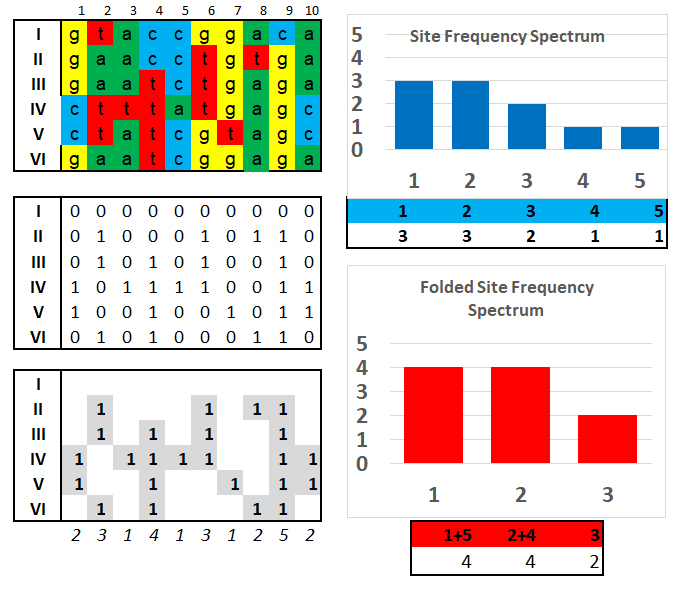
of the SFS and folded SFS for n
= 10 haploid individuals. With 10 positions,
there are n-1 = 9 classes, because
any SNP
variant
could occur in 1/10, 2/10, 3/10, ..., or 9/10
individuals: a base that occurs in 10/10
individuals would be invariant. The first matrix
shows the actual DNA sequence data. The
second matrix re-codes the first with a '0'
where the based matches the first individual and
"I" where there is a SNP difference. The
third matrix shows only the SNPs, and
counts the differences with respect to the first
individual. [Note that the first individual
necessarily shows all '0's].
The SFS matrix counts the number of derived SNP classes in the third matrix: there are three '1's, three '2's, two '3's and so on. Because it cannot be determined whether the character state in Individual I is actually ancestral or derived, the Folded SFS matrix combines the "1" and "5" classes (both of which have one character one way and five the other), and the "2" and "4" classes (both have two one way and three the other). The '3' class remains unchanged (it combines the three one way, three the other types). Then, the total number of SNP differences needed to explain the DNA data matrix is (1 x 4) + (2 x 4) + (3 x 2) = 18.
The SFS matrix counts the number of derived SNP classes in the third matrix: there are three '1's, three '2's, two '3's and so on. Because it cannot be determined whether the character state in Individual I is actually ancestral or derived, the Folded SFS matrix combines the "1" and "5" classes (both of which have one character one way and five the other), and the "2" and "4" classes (both have two one way and three the other). The '3' class remains unchanged (it combines the three one way, three the other types). Then, the total number of SNP differences needed to explain the DNA data matrix is (1 x 4) + (2 x 4) + (3 x 2) = 18.
Figure & Text material © 2022 by Steven M. Carr