
Basic Concepts of Coalescence: the MRCA
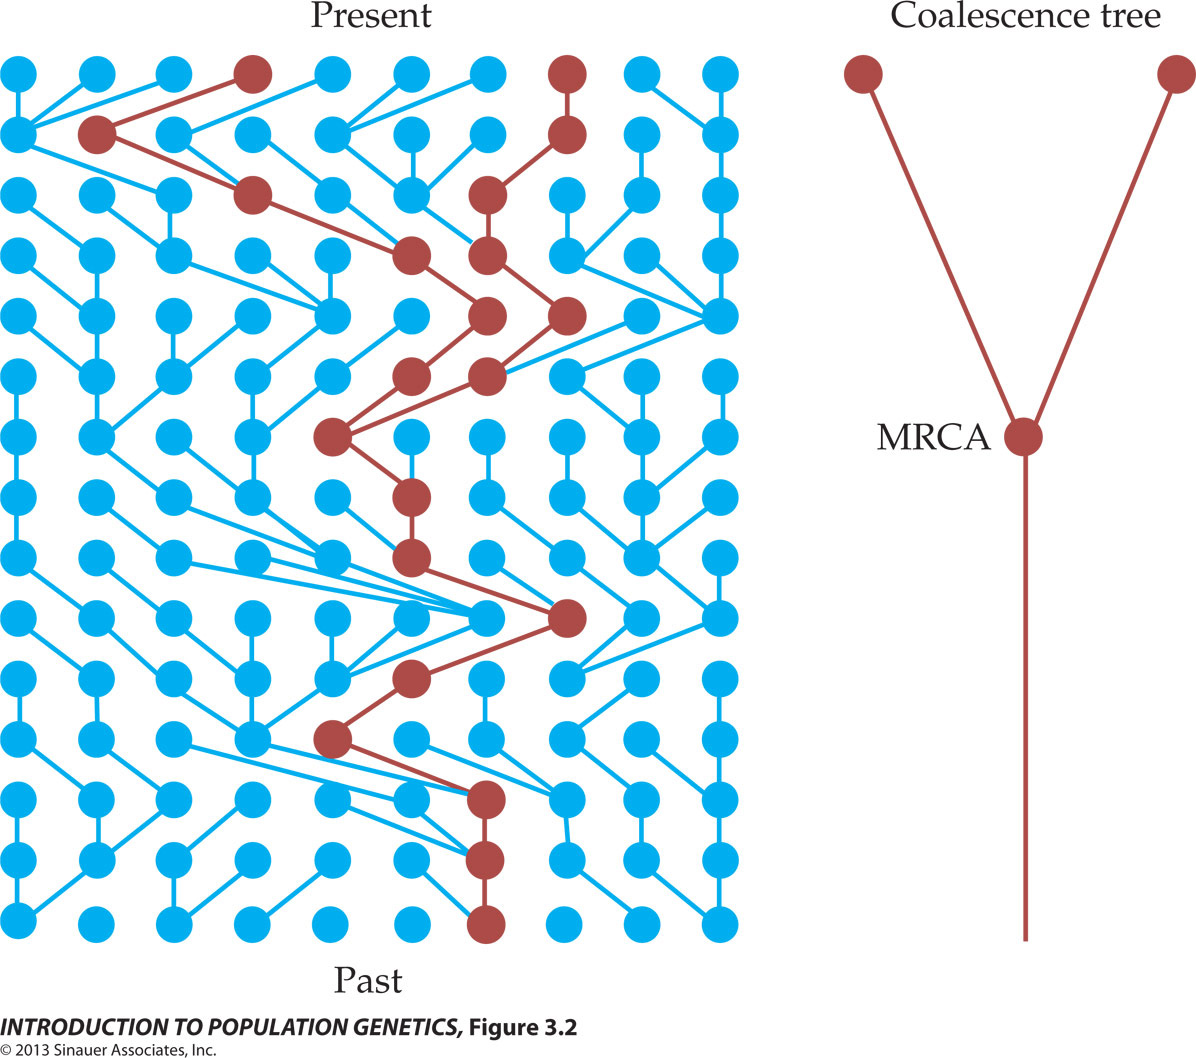
The array shows a population of haploid individuals
that has a constant size of N=10 for 15 generations.
Each horizontal row represents a generation; time
proceeds upward. Vertical lines in the graph
connect parent-to-offspring descent. The coalescent ancestry of the
two individuals sampled randomly from the Present generation
is highlighted in red. Tracing
both individuals from the Present (top row) downward
(backwards in time), the Most
Recent Common Ancestor (MRCA)
of both individuals is found in the sixth generation
backward from the present, when the two lineages coalesce on a single
individual. The figure on the right show the resulting coalescence tree for the two
individuals. The dots in the graph are called nodes.
The two at the top are leaf nodes corresponding to
the sampled individuals. The next older node down the tree
corresponds to the MRCA of the two individuals.
HOMEWORK:
The image from the textbook below contains at least one
error: identify & explain the error(s).
Figures redrawn from © 2013 by Sinauer; Text material © 2022 by Steven M. Carr