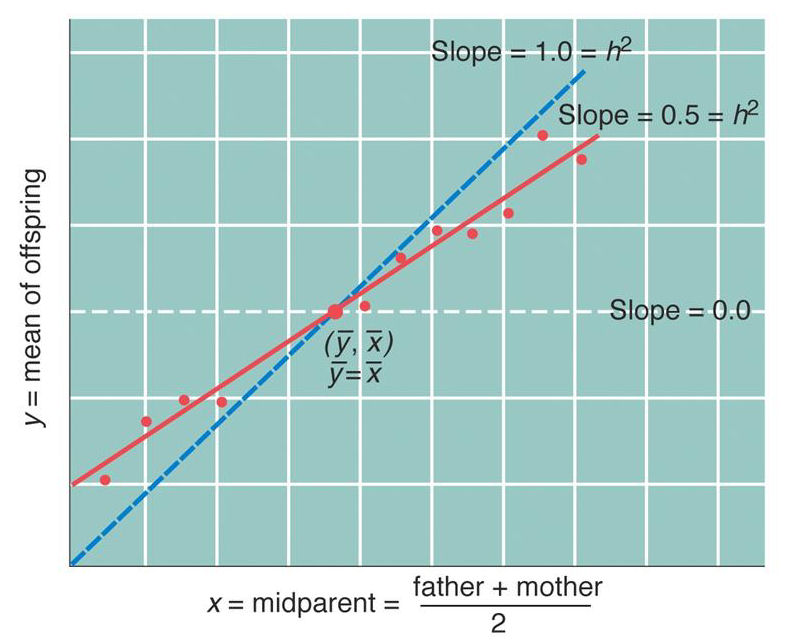
Mid-parent / offspring regression as an estimation of heritability (h2)
The red
dots show the correspondence between the phenotype
values of the offspring (Y-axis)
and the mid-parent
(the average of the two parents) (X-axis). The red line is the
calculated regression line,
which corresponds to the heritability
(h2).
Perfect heritability would be indicated by a line with slope
= 1.0 (dashed blue
line). Here, the points are somewhat more scattered,
and the slope and heritability are calculated as h2 =
0.5. The analysis is a regression, rather
than a correlation, because by the hypothesis the midparent
value predicts the offspring value.