Heterozygosity (H) vs estimated
Population Count
(Log10Nc) & Effective
Population Size (Neµ)
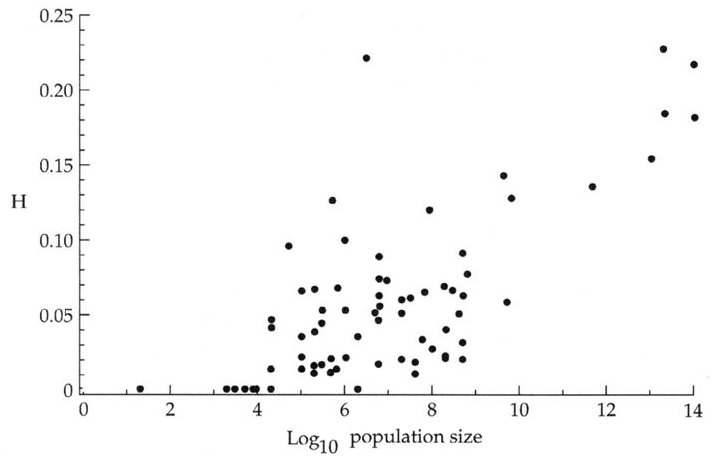
[Left] Observed Heterozygosity
based on protein
electrophoretic data increases with estimated population
count Nc over the range Hobs
= 0.01 ~ 0.25,
as expected.
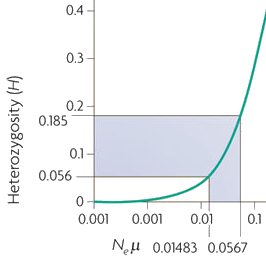
[Right] However, observed Hobs
is considerably smaller than expected from
theory, as He
= Neµ
/ (Neµ
+ 1). For a mutation rate µ
= 10-7, the observed range Hobs =
0.056 ~ 0.185 [Y-axis] implies Ne
= 148,000 ~ 567,000 [x-axis].
Left-hand
graph after Soulé in Ayala (1976); Text
material © 2025 by Steven M. Carr