Heritability as a Phenotype x Genotype correlation
Consider
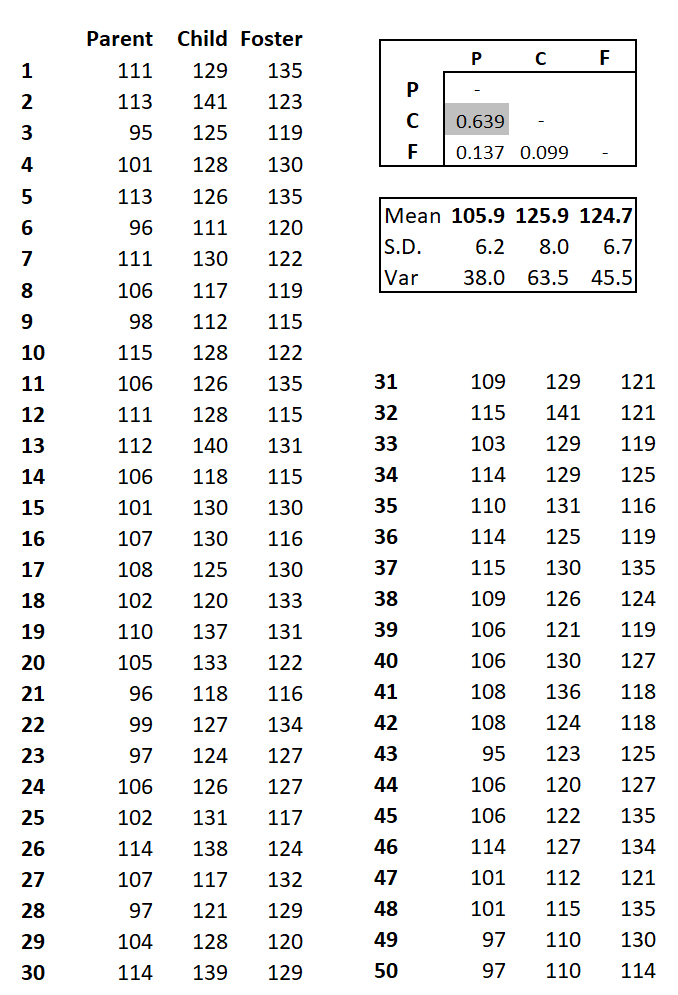
the educational test
scores for 50 children born
to one set of parents and fostered by another set. The Mid-Parent Value (mean
score) of the birth parents (P, "Parent") is 105. The Mid-Parent
Value of the foster parents (F, "Foster") is 125, 20 points
higher than that of the birth parents. After adoption, the
children (C) are provided with an "enriched"
environment. Their test scores after fostering
collectively achieve the same average (125) as their adoptive
parents, again 20 points higher than their birth
parents.
What does this tell us about the heritability of test scores? Despite the mean difference of 20 points, the correlation r (which is equivalent to heritability, h2) between birth parents and their children is rPxC = 0.639. The adopted children collectively achieve an identical mean score as the foster parents, however the correlation between them is a negligible rCxF = 0.099.
The exercise shows that a trait that is perfectly heritable may also be perfectly environmental. Enrichment improves mean test scores for the group, but is not predictable for any particular child. This numerical example disproves a common and invidious assumption, that heritability and "genetics" are not equivalent.
It might be that adoptive children are (deliberately or otherwise) placed with foster parents with similar socio-economic backgrounds as their birth parents. This might contribute to a similarity in their mean test scores. However, the correlation is also a negligible rPxF = 0.137.
HOMEWORK: The calculation of heritability as a correlation is straightforward as a spreadsheet problem, and is instructive from statistical first principles.
Numerical
examples & text material ©2025 by Steven M. Carr