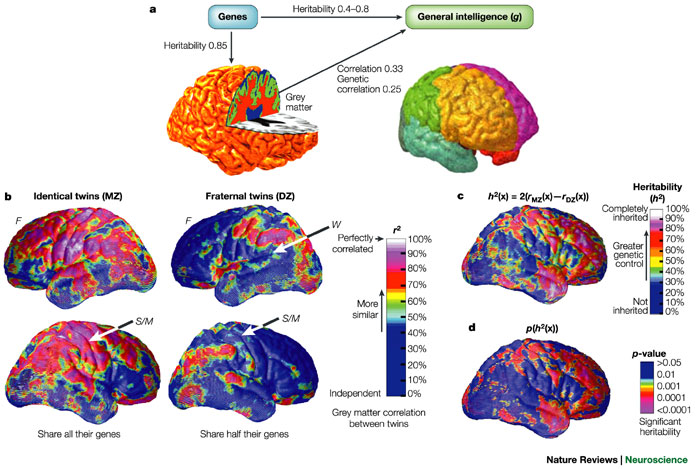
Linking genes, brain structure
and
intelligence.
(Gray & Thompson 2004)
a | Genetic influences on intelligence
have
been assessed directly (top arrow). The consensus of many
studies is that at least 40%
of the variability in general
cognitive ability ("Spearman's
g factor")
can be attributed to genetic factors. Gene effects on brain
structure
can be assessed by collecting MRI
(Magnetic Resonance
Imaging) brain
scans (left) from twins or
extended families, and comparing volumes of grey matter (green), white
matter (red) or cerebrospinal
fluid (blue). Overall
brain volume
is 85% heritable and
correlates with psychometric intelligence (0.33)*.
Genetic modelling has shown that g and grey matter volumes depend on the
same set of genes (the genetic correlation is about 0.25)*.
The volume of grey matter in each lobe is genetically influenced
to
different degrees (the volume of grey matter in the frontal lobe,
shown
at right in yellow and pink, is highly heritable).
b | Genetic influences on brain structure
can
be assessed using statistical maps.
In the classical twin design, a feature is heritable if
within-pair
correlations
(typically called intra-class correlations) are higher for
pairs of identical twins (who share all their genes, except for
rare
somatic mutations) and lower for same-sex fraternal twin pairs
(who, on
average, share half their genes). To better understand genetic
influences on brain structure, correlations are shown for regional
grey
matter volumes in sets of identical
(monozygotic (MZ)) and fraternal
(dizygotic (DZ)) twins. These correlations vary
across the brain
surface (red, highly correlated; blue, less well correlated). The
structure of the brains of identical twins is more similar than
that of
fraternal twins. F,
frontal cortex; S/M,
primary sensorimotor cortex;
W, Wernicke’s area.
c | Heritability (h2) is defined as the fraction of the phenotypic variance due to genotypic variance (as compared with environmental variance). Because monozygotic
(MZ) and dizygotic (DZ) twins are related by 1.0
and
0.5, respectively, heritability
for a trait value (x) can
be
estimated as twice the
difference between the correlations measured in monozygotic versus dizygotic
twins: h2(x) =
(2)(rMZ(x) -
rDZ(x)) . This
applies for example to measures of grey matter volumes at each
location
in the cortex.
d | Statistical significance of the
heritabilities.
These can also be estimated from path analyses. Variations in grey
matter volumes are strongly influenced by genetic factors,
especially
in frontal brain regions (for example, the dorso-lateral
pre-frontal
cortex). A subsequent study in a larger, independent sample found
that
variations in total grey matter volume were almost entirely
attributable to genetic factors (but three-dimensional maps of
these
effects were not created). These genetically mediated differences
in
brain structure explain a proportion of the variation in general
cognitive ability. This ability is also influenced by non-genetic
factors such as education and nutrition, prenatal and family
environments, training and environmental hazards such as lead
poisoning.
[*Note that "statistical significance" means that the degree of correlation is non-random, not that the value of the correlation is
large. In part (a), the
genetic
correlation of Spearman's g with brain metrics are significant (non-random)
but small (0.25 & 0.33). In general, studies
with more
data are able to identify statistical significance of smaller
phenotypic differences. ]