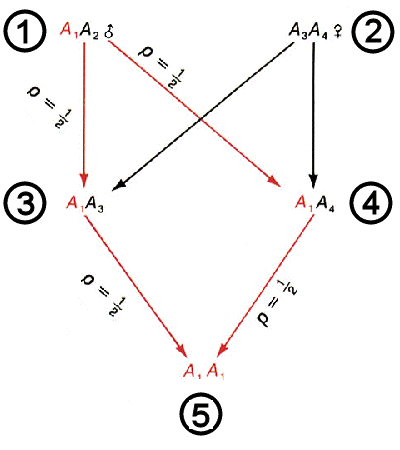
 Graphical calculations of the expectation of Identity by Descent
Consider a
single locus A in two
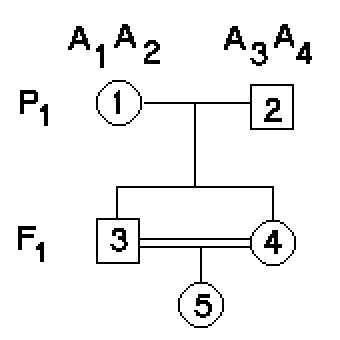
individuals #1 & # 2. Designate the four alleles
at this locus in these two individuals as A1 & A2, and A3 & A4, respectively. [We do not care whether the four alleles
are similar or dissimilar by allelic state (DNA
sequence)]. Individuals #3
and #4 are full sibs,
and inherit one allele from
each parent. Individual #5
is their offspring. What is the probability that 5 will inherit two alleles
that are identical by descent (IDB) at this locus?
A1 passes from #1 to #3 with
a probability of 1/2, AND to #4 with a probability of 1/2. Given that
it has passed to both offspring, it then passes from #3
to #5 with a probability of 1/2, AND from #4 to #5 with a probability of 1/2.
Thus, the joint probability that A1 has passed from #1 to #5 through both #3 and #4 is (1/2)4 = 1/16.
The same calculation can be repeated for
alleles A2, A3 & A4. Then, the combined probability that
5 has two alleles
identical by descent at this locus, that is, has two copies of A1 OR A2 OR A3 OR A4
, is 1/16 + 1/16 + 1/16
+ 1/16 = 1/4.
Since this calculation applies for every locus
individually, the total fraction
of loci with alleles identical by descent is also 1/4,
which is the Inbreeding Coefficient for full-sibs.
A small sample of loci may depart from expectation, but as the
sample of the genome increases, the observed fraction
converges on expectation because of the Central Limit
Theorem.
HOMEWORK: The genetic consequences of first-cousin
marriages (e.g., between Charles Darwin and Emma Wedgwood)
are often of interest. Extend the graphical method above
to show that the inbreeding coefficient for the children of such
marriages is 1/16.


