Genetic Drift among populations over Time
Beginning
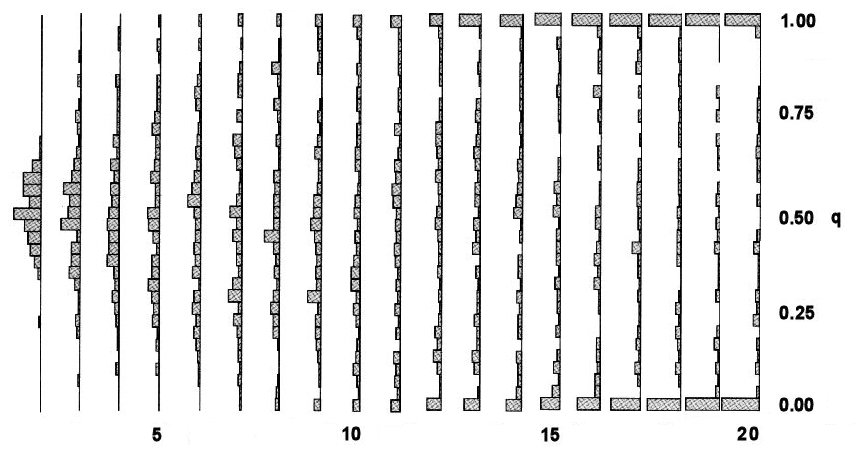
in Generation 1 [not shown] with 50 populations
all with N =
10 and f(B) = q = 0.5,
random drift across populations produces a normal
distribution with a mean of q = 0.5 in
Generation 2. In successive generations, drift of q
within populations increases the variance of
q among populations. In Generation 5,
one population has become fixed for B (q =
1.0), and starting in Generation 8, one
population has lost allele B (q =
0.0). The distribution of q
across populations is roughly flat by Generation 10,
and is strongly U-shaped by Generation 20.
Fixation and loss are "absorbing barriers": once
allelic diversity in a population has been lost, it cannot be
regained. In this simulation, about 30% of the populations
have each lost or fixed allele B by Generation 20.
HOMEWORK: Repeat this simulation with the MatLab program WriFish.m with 50 populations of N = 10 @ for 20 generations. Compare that display with the one here. Can you see the same pattern of a U-shaped distribution after 20 generations?
HOMEWORK: Repeat this simulation with the MatLab program WriFish.m with 50 populations of N = 10 @ for 20 generations. Compare that display with the one here. Can you see the same pattern of a U-shaped distribution after 20 generations?