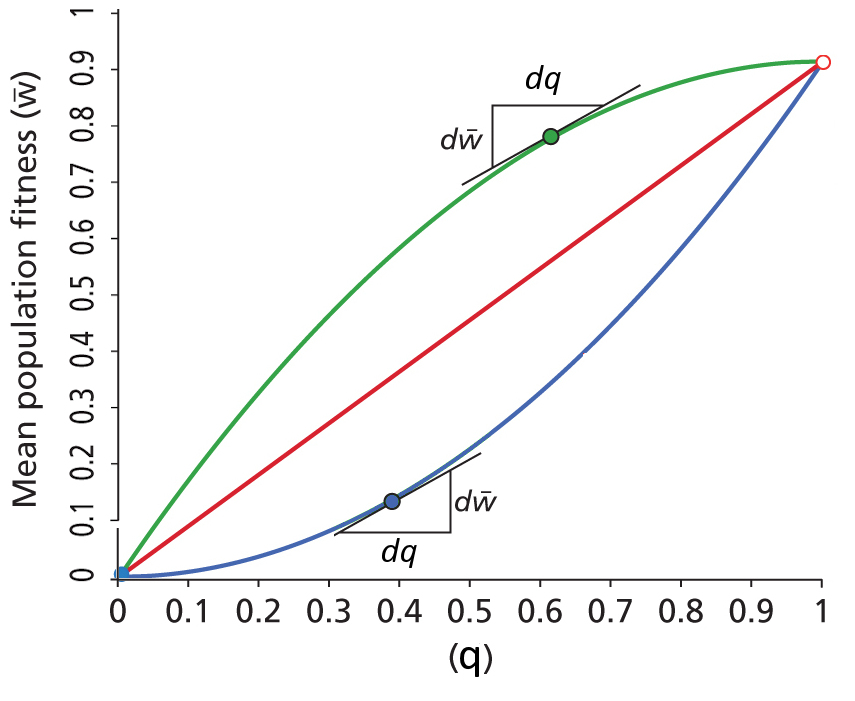
Change in mean population fitness (![]() ) under
three models of Dominance of Fitness
) under
three models of Dominance of Fitness
Dominance, Additive,
and Recessive models
proceed according to the General Selection Model.
The three curves show
the mean population fitness
(![]() ) for
the three models, as q
) for
the three models, as q ![]() 1, where q
is associated with the more fit phenotypes.
1, where q
is associated with the more fit phenotypes.
The slope of the
fitness curve is always positive, however the first
derivative (d![]() / dq)
shows how the change
in the slope varies as q
/ dq)
shows how the change
in the slope varies as q ![]() 1.
In the dominance model,
the slope is initially rapid and then decreases.
In the additive model,
slope is constant. In
the recessive model,
the slope is initially slow and then increases.
1.
In the dominance model,
the slope is initially rapid and then decreases.
In the additive model,
slope is constant. In
the recessive model,
the slope is initially slow and then increases.
HOMEWORK: Observe
that the dominant and
recessive curves have
the same shape, that is, if the green curve is
flipped across the red curve, and flipped again along
its length. Explain.