Monte Carlo simulation of phylogeographic models of dispersal in Harp Seals (Pagophilus groendlandicus)
Statistical tests usually
rely on comparing a sample of a population with the known
distribution of events in that population. Many
statistical tests rely on the assumption that the actual
population follow the normal distribution. When
the distribution is unknown, Monte Carlo methods can
estimate its shape with multiple random simulations. (The name
comes from the idea that, if you didn't know anything about a roulette
wheel, a few hundred random turns would likely show you
that all numbers between 0 and 36 can occur, and
a few thousand would show that they are equally likely). Then,
given an experimental observed distribution of events
compared with the well-defined random simulation
of that distribution, it is possible to test whether the observed
pattern is significantly better than random.
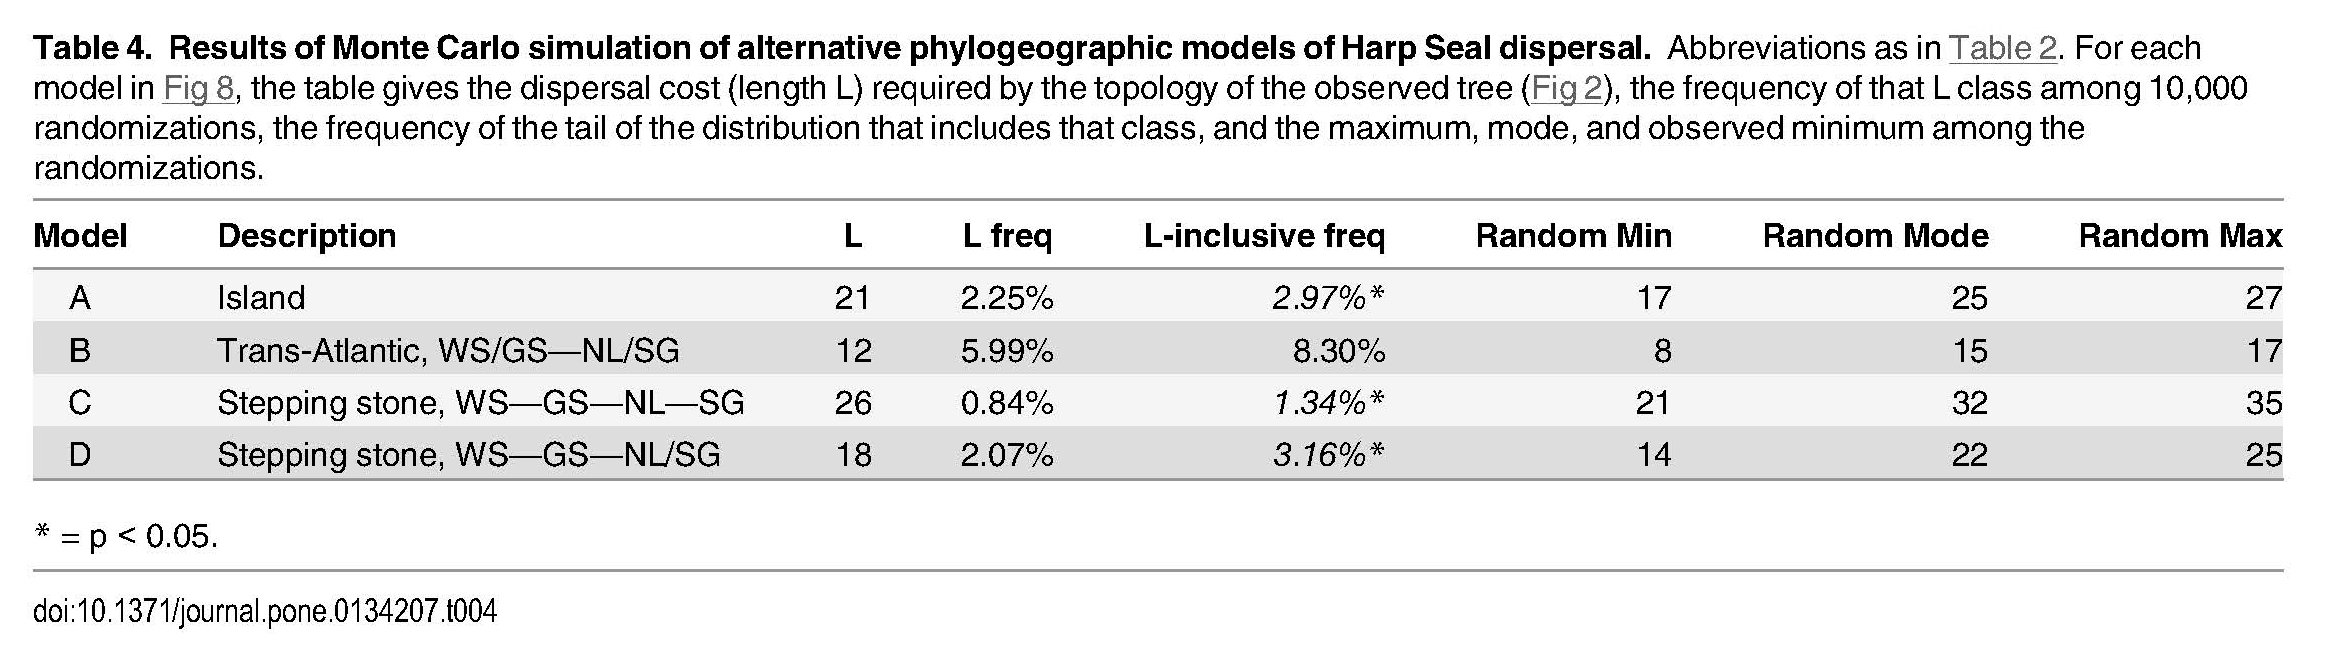
In this test, the best phylogenetic tree of seals from N = 4 populations is known, and the number of dispersal events (L) necessary to explain that distribution can be counted as L=21. Model A is the standard "island model", in which individuals in any of the L = 4 populations disperse randomly to the others. The Monte Carlo procedure then scatters the seals at random over the branch trips of the known tree, and counts the number of events L necessary to explain each. This is repeated 10,000 times. The table shows that, for the four-island model, the tail of the distribution requiring 21 events or less is 3% of the total, thus p < 0.05*. Therefore the observed distribution is significantly better than the Island Model predicts. Models B, C, & D test structured Stepping-Stone Models with L = 2, 4, & 3 populations, as described.
In this test, the best phylogenetic tree of seals from N = 4 populations is known, and the number of dispersal events (L) necessary to explain that distribution can be counted as L=21. Model A is the standard "island model", in which individuals in any of the L = 4 populations disperse randomly to the others. The Monte Carlo procedure then scatters the seals at random over the branch trips of the known tree, and counts the number of events L necessary to explain each. This is repeated 10,000 times. The table shows that, for the four-island model, the tail of the distribution requiring 21 events or less is 3% of the total, thus p < 0.05*. Therefore the observed distribution is significantly better than the Island Model predicts. Models B, C, & D test structured Stepping-Stone Models with L = 2, 4, & 3 populations, as described.