Estimation of selection
coefficients for the Sickle-Cell
allele S
The standard allele at the Beta-Globin
locus is designated A, and most individuals
are homozygous for this allele (AA). An alternative
allele, S, when homozygous (SS) results in
sickle-cell anemia, a severe form of anemia that
typically results in death at an early age. Individuals
that are heterozygous (AS) are said to have sickle-cell
trait, a much milder form of anemia that is
seldom life-threatening. [Be sure to distinguish "trait"
from "anemia"]. Sickle-cell anemia was the first
human "molecular disease" to be identified, when in
1949 it was shown that the S hemoglobin
has a Val
Glu substitution. After the "Genetic
Code" was cracked in 1965, this was shown to arise
from a 2nd-position SNP in the sixth triplet.
In the early 1950s, it was further
proposed that AS individuals in West Africa were
at a selective advantage to AA individuals,
because the AS phenotype protected individuals
from the malarial parasite. [Both A and S represent
multiple alleles with the same or similar effect].
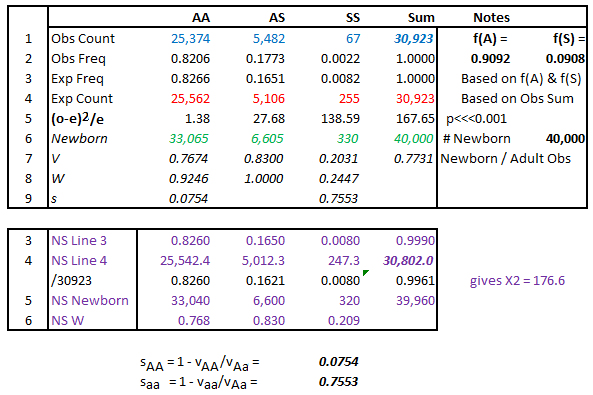
In a study designed to test this hypothesis, a group of 30,923 West African adults were typed, with results as shown (Line 1). From these data, the observed frequencies of each genotype are easily determined (Line 2, left), and from these data the observed frequencies f(A) and f(S) are determined by the usual calculation (Line 2, right).
Let p = f(A) and q = f(S). Then the expected genotype frequencies f(AA), f(AS), and f(SS) are p2, 2pq, and q2 , respectively (Line 3), and the expected numbers of individuals is that proportion out of 30,923 (Line 4).
A Chi-Square analysis (Line 5) of the observed (Line 1) versus the expected (Line 4) numbers of adults with each genotype indicates a highly significant (p <<< 0.0001) deviation from expectation. As predicted by the hypothesis, the deviation is due to (1) a higher than expected proportion of AS individuals, consistent with a selective advantage relative to AA individuals, and (2) a much lower than expected number of SS individuals, consistent with the known selective disadvantage of sickle-cell anemia.
To estimate the selection coefficients against the AA (sAA) and SS (sSS) genotypes in a malarial environment, we would ideally need the genotype counts in a group of newborns and later in those same group members who survive to adulthood. In this study, we lack the former: however, estimation requires only knowledge of relative viability of AA and SS with respect to AS as the optimal genotype (W = 1.0). We may assume that allele frequencies are presently at equilibrium ( q
= 0.0), that is, f(A) = 0.9092 and f(S) =
0.0908 (Line 2), such that the expected frequencies in
Newborns are given by Line 3. Suppose that the 30,923
adults examined in Line 1 are the survivors of a group of
arbitrary size*
(here, 40,000) with
genotype counts as expected for a population of
that size (Line 6). Then, the Viability (V)
of each genotype is simply the observed adult count
divided by the estimated newborn count (Line 1 /
Line 6 = Line 7). Divide all viabilities by the optimum
viability (VAS) to obtain their
normalized Fitness with respect to WAS
= 1.0 (Line 8). Express the Fitness values WAA
and WSS as selection
coefficients sAA = 1 - WAA
and sSS = 1 - WSS
respectively. [Note the
alternative calculations below the lower Box 2 that
combines these into a single operation].
q
= 0.0), that is, f(A) = 0.9092 and f(S) =
0.0908 (Line 2), such that the expected frequencies in
Newborns are given by Line 3. Suppose that the 30,923
adults examined in Line 1 are the survivors of a group of
arbitrary size*
(here, 40,000) with
genotype counts as expected for a population of
that size (Line 6). Then, the Viability (V)
of each genotype is simply the observed adult count
divided by the estimated newborn count (Line 1 /
Line 6 = Line 7). Divide all viabilities by the optimum
viability (VAS) to obtain their
normalized Fitness with respect to WAS
= 1.0 (Line 8). Express the Fitness values WAA
and WSS as selection
coefficients sAA = 1 - WAA
and sSS = 1 - WSS
respectively. [Note the
alternative calculations below the lower Box 2 that
combines these into a single operation].
HOMEWORK 1: The S allele occurs at lower frequencies in some Middle Eastern countries. A recent survey of 56,000 hospitalized patients in one such country identified 1,120 with sickle-cell disease (SS) and 13,440 with sickle-cell trait (AS). Based on the example here, calculate observed and expected allele and genotype frequencies, perform the Chi-Square analysis, and estimate the selection coefficients against AA and SS.
HOMEWORK 2: (1) We estimated selection coefficients based on estimated numerical proportions of newborns, based on equilibrium allele frequencies calculated from adults. Is this valid, or not? Explain. (2) *The arbitrary assumption of a newborn group of size N (Line 6) may strike you as odd: why does the exact size chosen for Line 6 not make a difference? [Answer both questions numerically: HINT - repeat the calculation with a different value].
In a study designed to test this hypothesis, a group of 30,923 West African adults were typed, with results as shown (Line 1). From these data, the observed frequencies of each genotype are easily determined (Line 2, left), and from these data the observed frequencies f(A) and f(S) are determined by the usual calculation (Line 2, right).
Let p = f(A) and q = f(S). Then the expected genotype frequencies f(AA), f(AS), and f(SS) are p2, 2pq, and q2 , respectively (Line 3), and the expected numbers of individuals is that proportion out of 30,923 (Line 4).
A Chi-Square analysis (Line 5) of the observed (Line 1) versus the expected (Line 4) numbers of adults with each genotype indicates a highly significant (p <<< 0.0001) deviation from expectation. As predicted by the hypothesis, the deviation is due to (1) a higher than expected proportion of AS individuals, consistent with a selective advantage relative to AA individuals, and (2) a much lower than expected number of SS individuals, consistent with the known selective disadvantage of sickle-cell anemia.
To estimate the selection coefficients against the AA (sAA) and SS (sSS) genotypes in a malarial environment, we would ideally need the genotype counts in a group of newborns and later in those same group members who survive to adulthood. In this study, we lack the former: however, estimation requires only knowledge of relative viability of AA and SS with respect to AS as the optimal genotype (W = 1.0). We may assume that allele frequencies are presently at equilibrium (
HOMEWORK 1: The S allele occurs at lower frequencies in some Middle Eastern countries. A recent survey of 56,000 hospitalized patients in one such country identified 1,120 with sickle-cell disease (SS) and 13,440 with sickle-cell trait (AS). Based on the example here, calculate observed and expected allele and genotype frequencies, perform the Chi-Square analysis, and estimate the selection coefficients against AA and SS.
HOMEWORK 2: (1) We estimated selection coefficients based on estimated numerical proportions of newborns, based on equilibrium allele frequencies calculated from adults. Is this valid, or not? Explain. (2) *The arbitrary assumption of a newborn group of size N (Line 6) may strike you as odd: why does the exact size chosen for Line 6 not make a difference? [Answer both questions numerically: HINT - repeat the calculation with a different value].
Example modified from © 2013 Sinauer; © 2024 by Steven M. Carr