Origins of Molecular Biology:

SE Luria & M Delbruck (1943). Mutations of bacteria from virus sensitivity to virus resistance. Genetics 28:491


Background

Max Delbruck (1906 -1981) &  Salvador Luria (1912 - 1991)
    1969 Nobel Prize in Physiology or Medicine

Bacteriology <1940 not influenced by genetic thinking
    No nuclei: do they have "genes"?
    No individual "phenotypes": colonies of 106s bacteria w/ characteristic appearance
    No sex: genetic crosses not possible
        [Discovery of bacterial sex led to 1958 Nobel Prize]

bacteriophages ("phages") - Sub-cellular parasites that infect, multiply within, & kill bacteria
     [phage] >> [bacteria]   no bacterial colonies grow: bacteria Tons ("T-one sensitive")
     [phage]  ~  [bacteria] some bacterial colonies grow: bacteria Tonr ("T-one resistant")
      Tonr phenotype stable, heritable
            all descendant bacteria are Tonr
            phenotype persists in absence of phage

Two Hypotheses (d'Herelle 1926 vs Brunet 1929)
    Tonr phenotype induced by exposure of bacteria to phage
        Any bacterium has small, finite prob of survival (p  ~ 1 / 107);
           Survivors have altered metabolic phenotypetransmitted to offspring:
             changed phenotype persists in genotype
        Bacteria adapt to their environment :
            Lamarckian: Tonr an acquired characteristic

    Tonr phenotype occurs spontaneously prior to exposure of bacteria to phage
        Some rare bacteria  (f  ~ 1 / 107) are already Tonr
             underwent genetic mutation to a stable genotype
             changed genotype regenerates phenotype
        Darwinian: Tonr bacteria selected


Materials & Methods

Hypotheses predict different distributions of
Tonr phenotypes among cultures

Induction Hypothesis predicts: n / N = a
    where n = number of Tonr bacteria observed out of
               N = number of Tons bacteria plated, where
                a = probability of conversion from Tons to Tonr
   Then, n should be constant wrt N

Mutation Hypothesis predicts: n / N = ga2g / 2g = ga
    where a = mutation rate (# mutations / cell / generation)
               g = # generations to go from 1 N bacteria, so that
               N = 2g doublings occur, of which
               n = ga2g produce mutant Tonr  bacteria
                      because a mutation in the i th generation contributes a2i2g-i = a2g mutants
    Then, n should increase wrt N as g increases

How can differences in n be evaluated? A Thought experiment

Induction Hypothesis:
    Tonr induction occurs in last generation upon exposure to T1
    probability of induction (a) is uniform / bacterium
      a = 10 inductions / 64 cells = 15%
       observe = 3, 1, 5, & 1 Tonr colonies
       mean = 10 / 4 = 2.5 Tonr  per culture
       variance = 2.75
       Expect Poisson Distribution for rare, random events: variance = mean
                        Homework:
Evaluate 16 plants / 64 quadrats distribution by Chi-Square


Mutation Hypothesis
    Tonr mutations occur spontaneously, prior to exposure to T1
     mutation rate (a) = 2 events / 60 cell divisions = 0.033 mutations / cell / generation
        mean = (2 + 0 + 8 + 0) / 4 = 2.5 Tonr as before
        After 4 generations, early mutations leave more offspring
             variance 10.75
       after 5 generations, # of Tonr cells doubles in each culture:
             variance 48.00

        Mutation Hypothesis predicts variance >> mean, as g increases
 

Experimental procedure:

"The first experiment was done on the following Sunday morning.
(In a letter dated January 21 [1943], Delbruck exhorted me to go to church"

    Twenty  x  200 ul "individual cultures"
    One x 10 ml "bulk culture"
    Inoculate with ~ 103 bacteria @
    Grow for g = 17 generations
           ~108 bacteria / ml
         Plate entire "individual cultures"
                  & 200 ul aliquots of "bulk culture" on petri dish w/ T1


Results


Bulk
Cultures

Individual
Cultures

Experiment ##
10a
16
Mean
16.7
11.3
Variance
15
694
Variance (smc)
18.2
752.1

Single bulk culture (e.g., Experiment 10a):
   Ten replicates samples of same culture
  a = n / N = (16.7 / (0.2 ml x 108 bacteria / ml) = 8 x 10⁻⁷  variants / cell
    variance ~ mean random distribution
    Expected result for either induced or spontaneous hypotheses: a control

Multiple individual cultures (e.g., Experiment 16):
    mean ~ mean in bulk
    variance >> variance in bulk:
        Experiment supports Mutation Hypothesis !

 Calculation of Mutation rate (a)
        mean # mutations / culture = aN
        Poisson predicts null class p0  = exp(- a/N) 
           where p0 = fraction of cultures with no Tonr mutants
           Rewrite as    a = - ln (p0 / N )
                   p0  = 11 / 20 = 0.55 from Experiment 16
                   N = 0.2 ml x 108 bacteria / ml
        Then a = -ln 0.55 / (0.2 x 10⁸) = 3 x 10⁻⁸ mutations / cell / generation
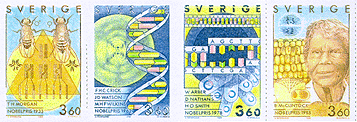

Conclusion

Nobel
                    Stamps 1989
January 24, 1943

Salvador

"You are right about the difference in fluctuations of resistants, when plating samples from one or from several cultures. In the latter case, the number of clones has a Poisson distribution.  I think what this problem needs is a worked out and written down theory, and I have begun doing so."
 
Max

"The MS of the theory arrived on February 3rd ...."

Luria on significance of experiments:
    (1) "Adequate evidence" of spontaneous mutation as source of genetic variation
    (2) Provided method for measuring mutation rates, and therefore is
    (3) "The Birth of Molecular Genetics"
          bacteria can be used to measure extremely low gene mutation rates

Homework: repeat above calculations for Experiments 3 & 21a


All text material ©2022 by Steven M. Carr