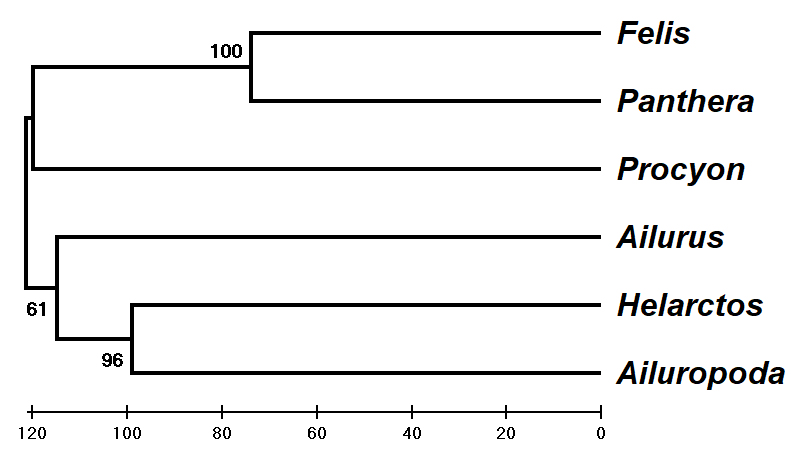
(A) UPGMA, # nucs, 3K bootstrap
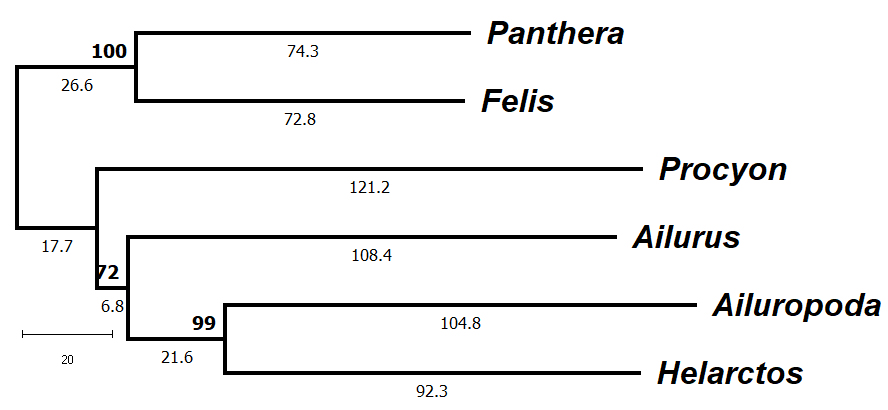
(B) Neighbor-Joining, # nucs, 3K bootstrap
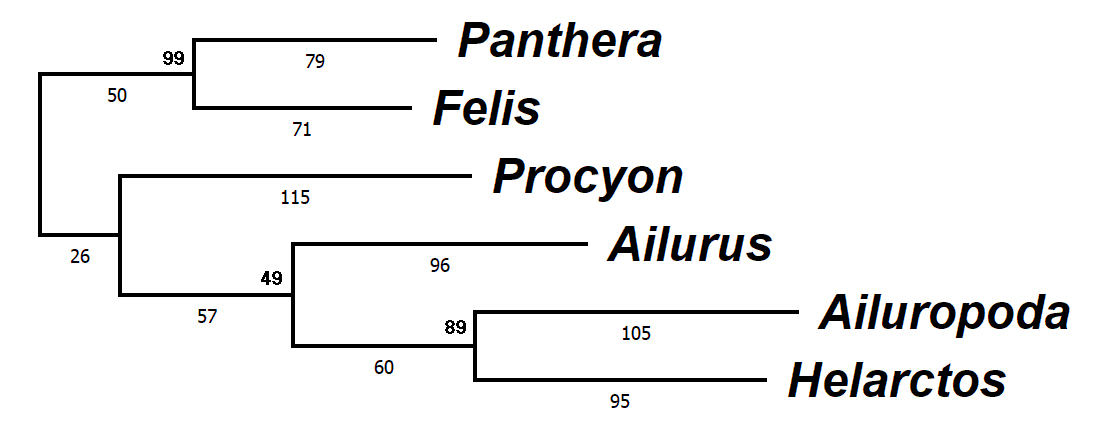
(C) Maximum Parsimony, # nucs, 3K bootstrap
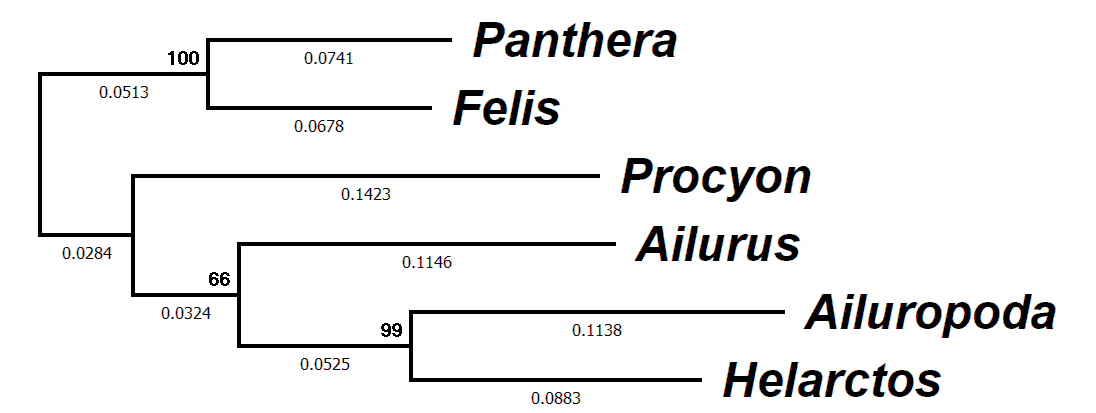
(D) Maximum Likelihood, 3K bootstrap
Evolutionary
genetic relationships among six Carnivora
1140bp mtDNA Cytochrome b
Results
from four methods:
UPGMA,
# nucs, 3K bootstrap: Scale shows degree of similarity for
successive clusters
NJ, # nucs, 3K bootstrap: Branch lengths show
inferred amount of change along each branch
MP, # nucs, 3K bootstrap: Branch lengths show
inferred number of changed in minimum length tree, L = 753
ML, 3K bootstrap: Branch lengths show likelihood of
each branch in maximum likelihood tree