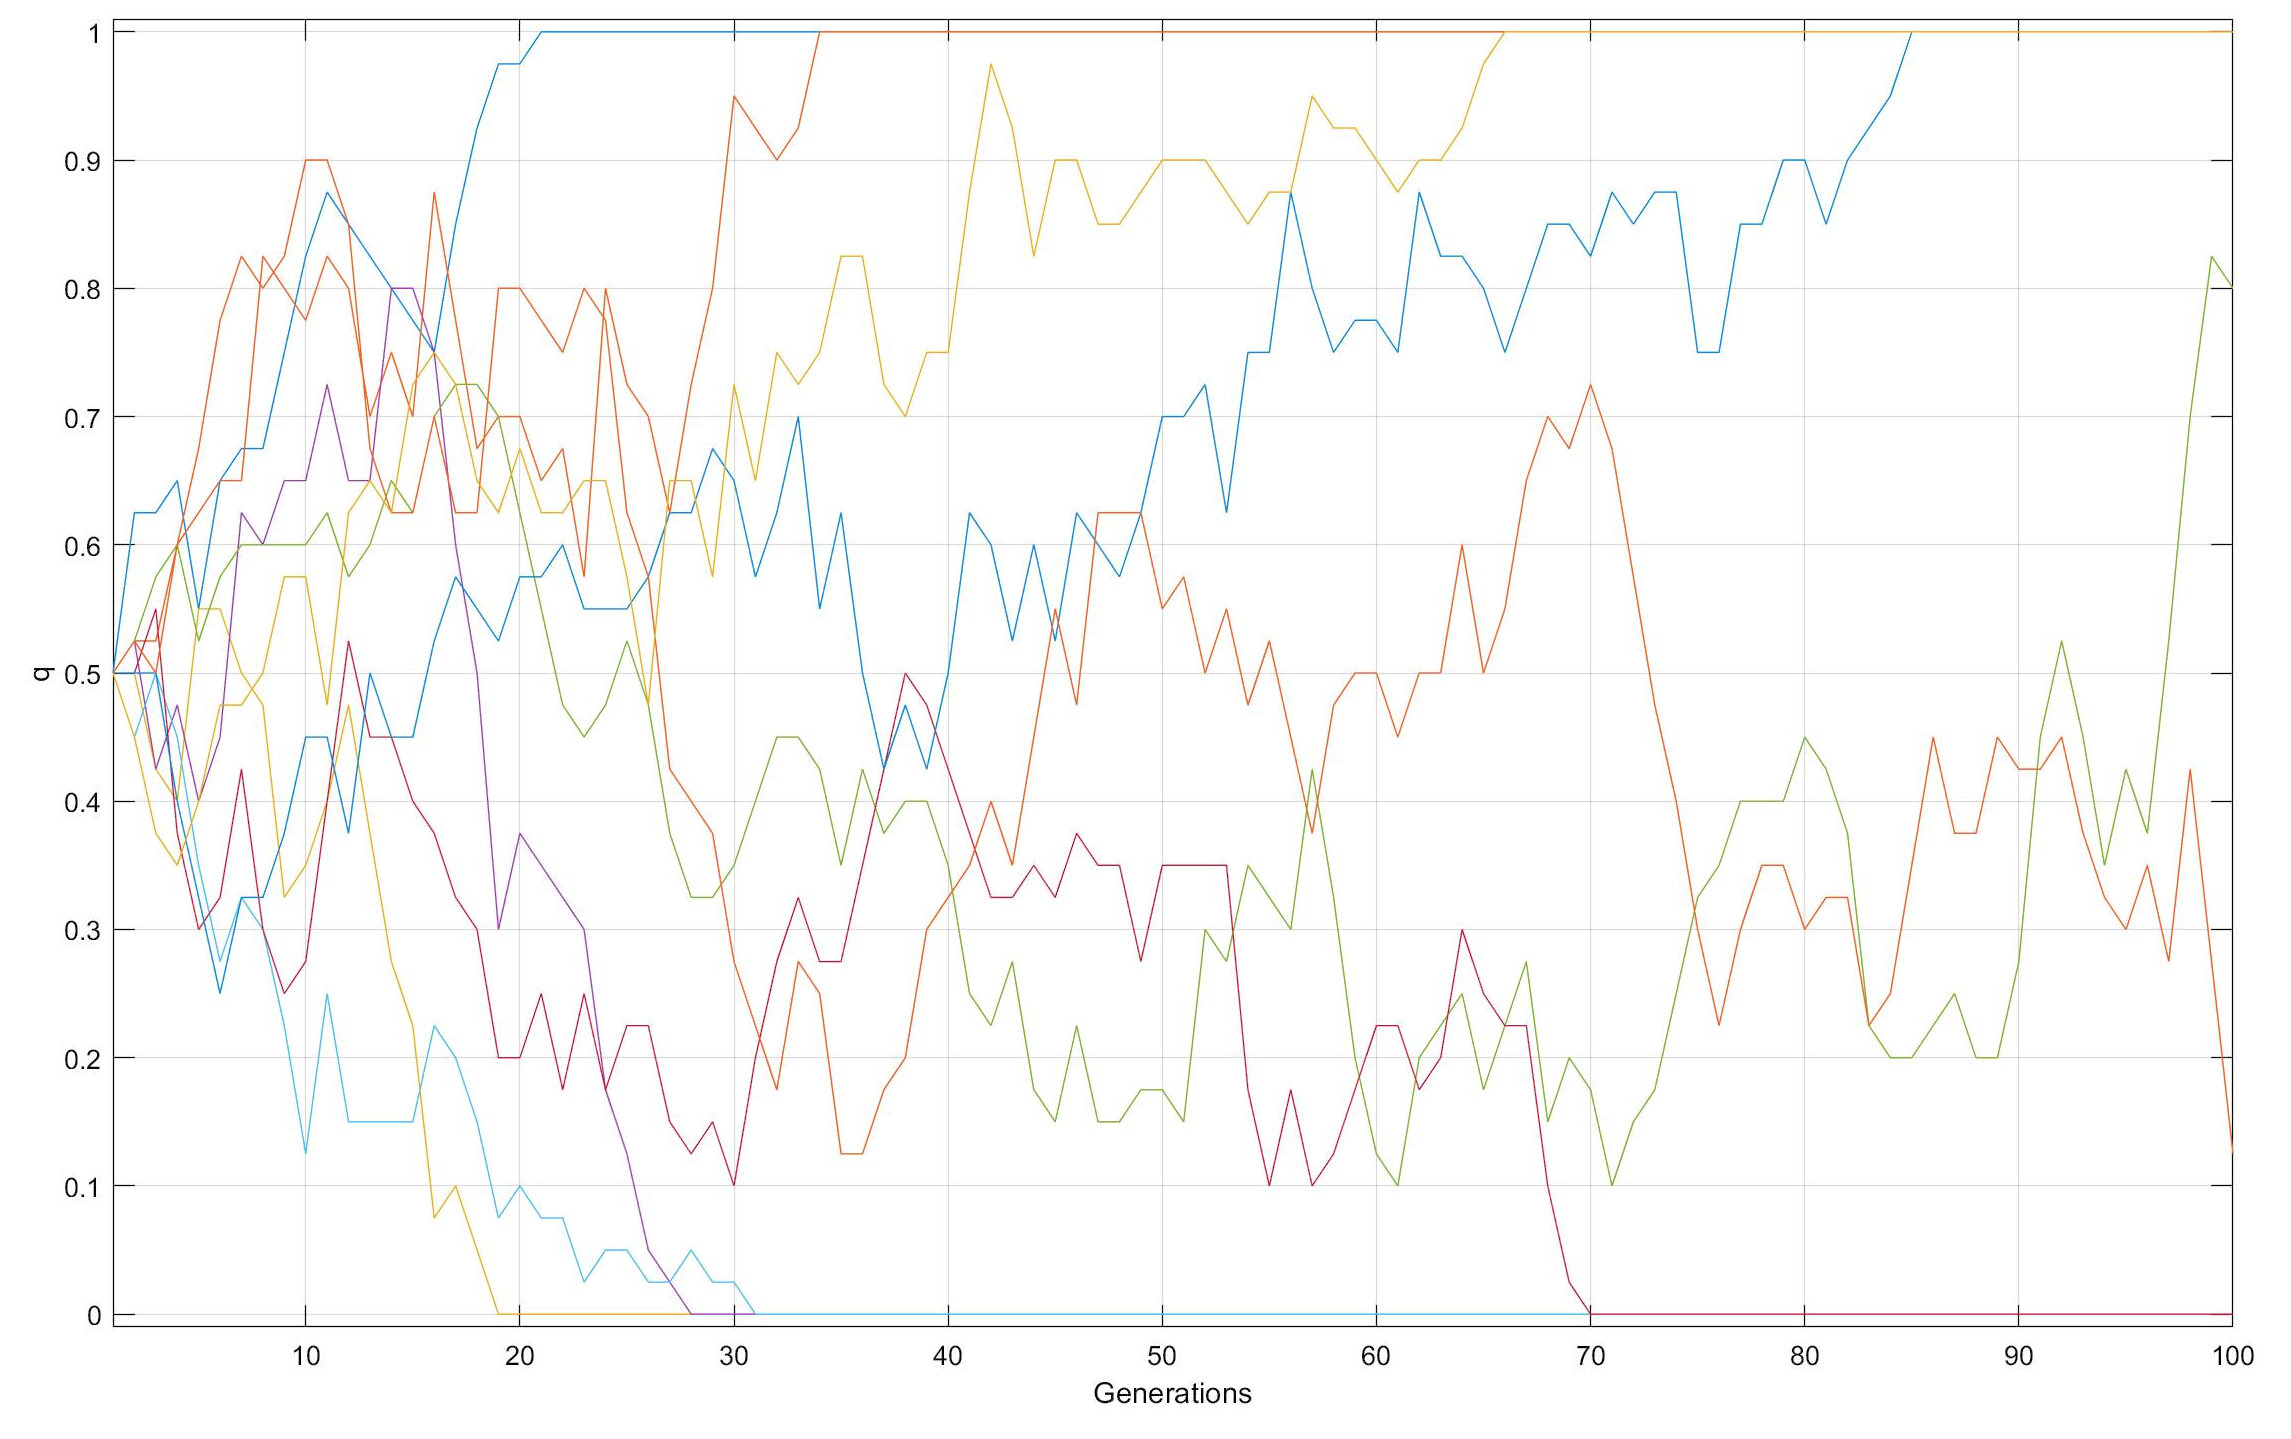
Genetic Drift over time in Smaller versus Larger populations
From an initial q = f(B) = 0.50 in each of 10 populations
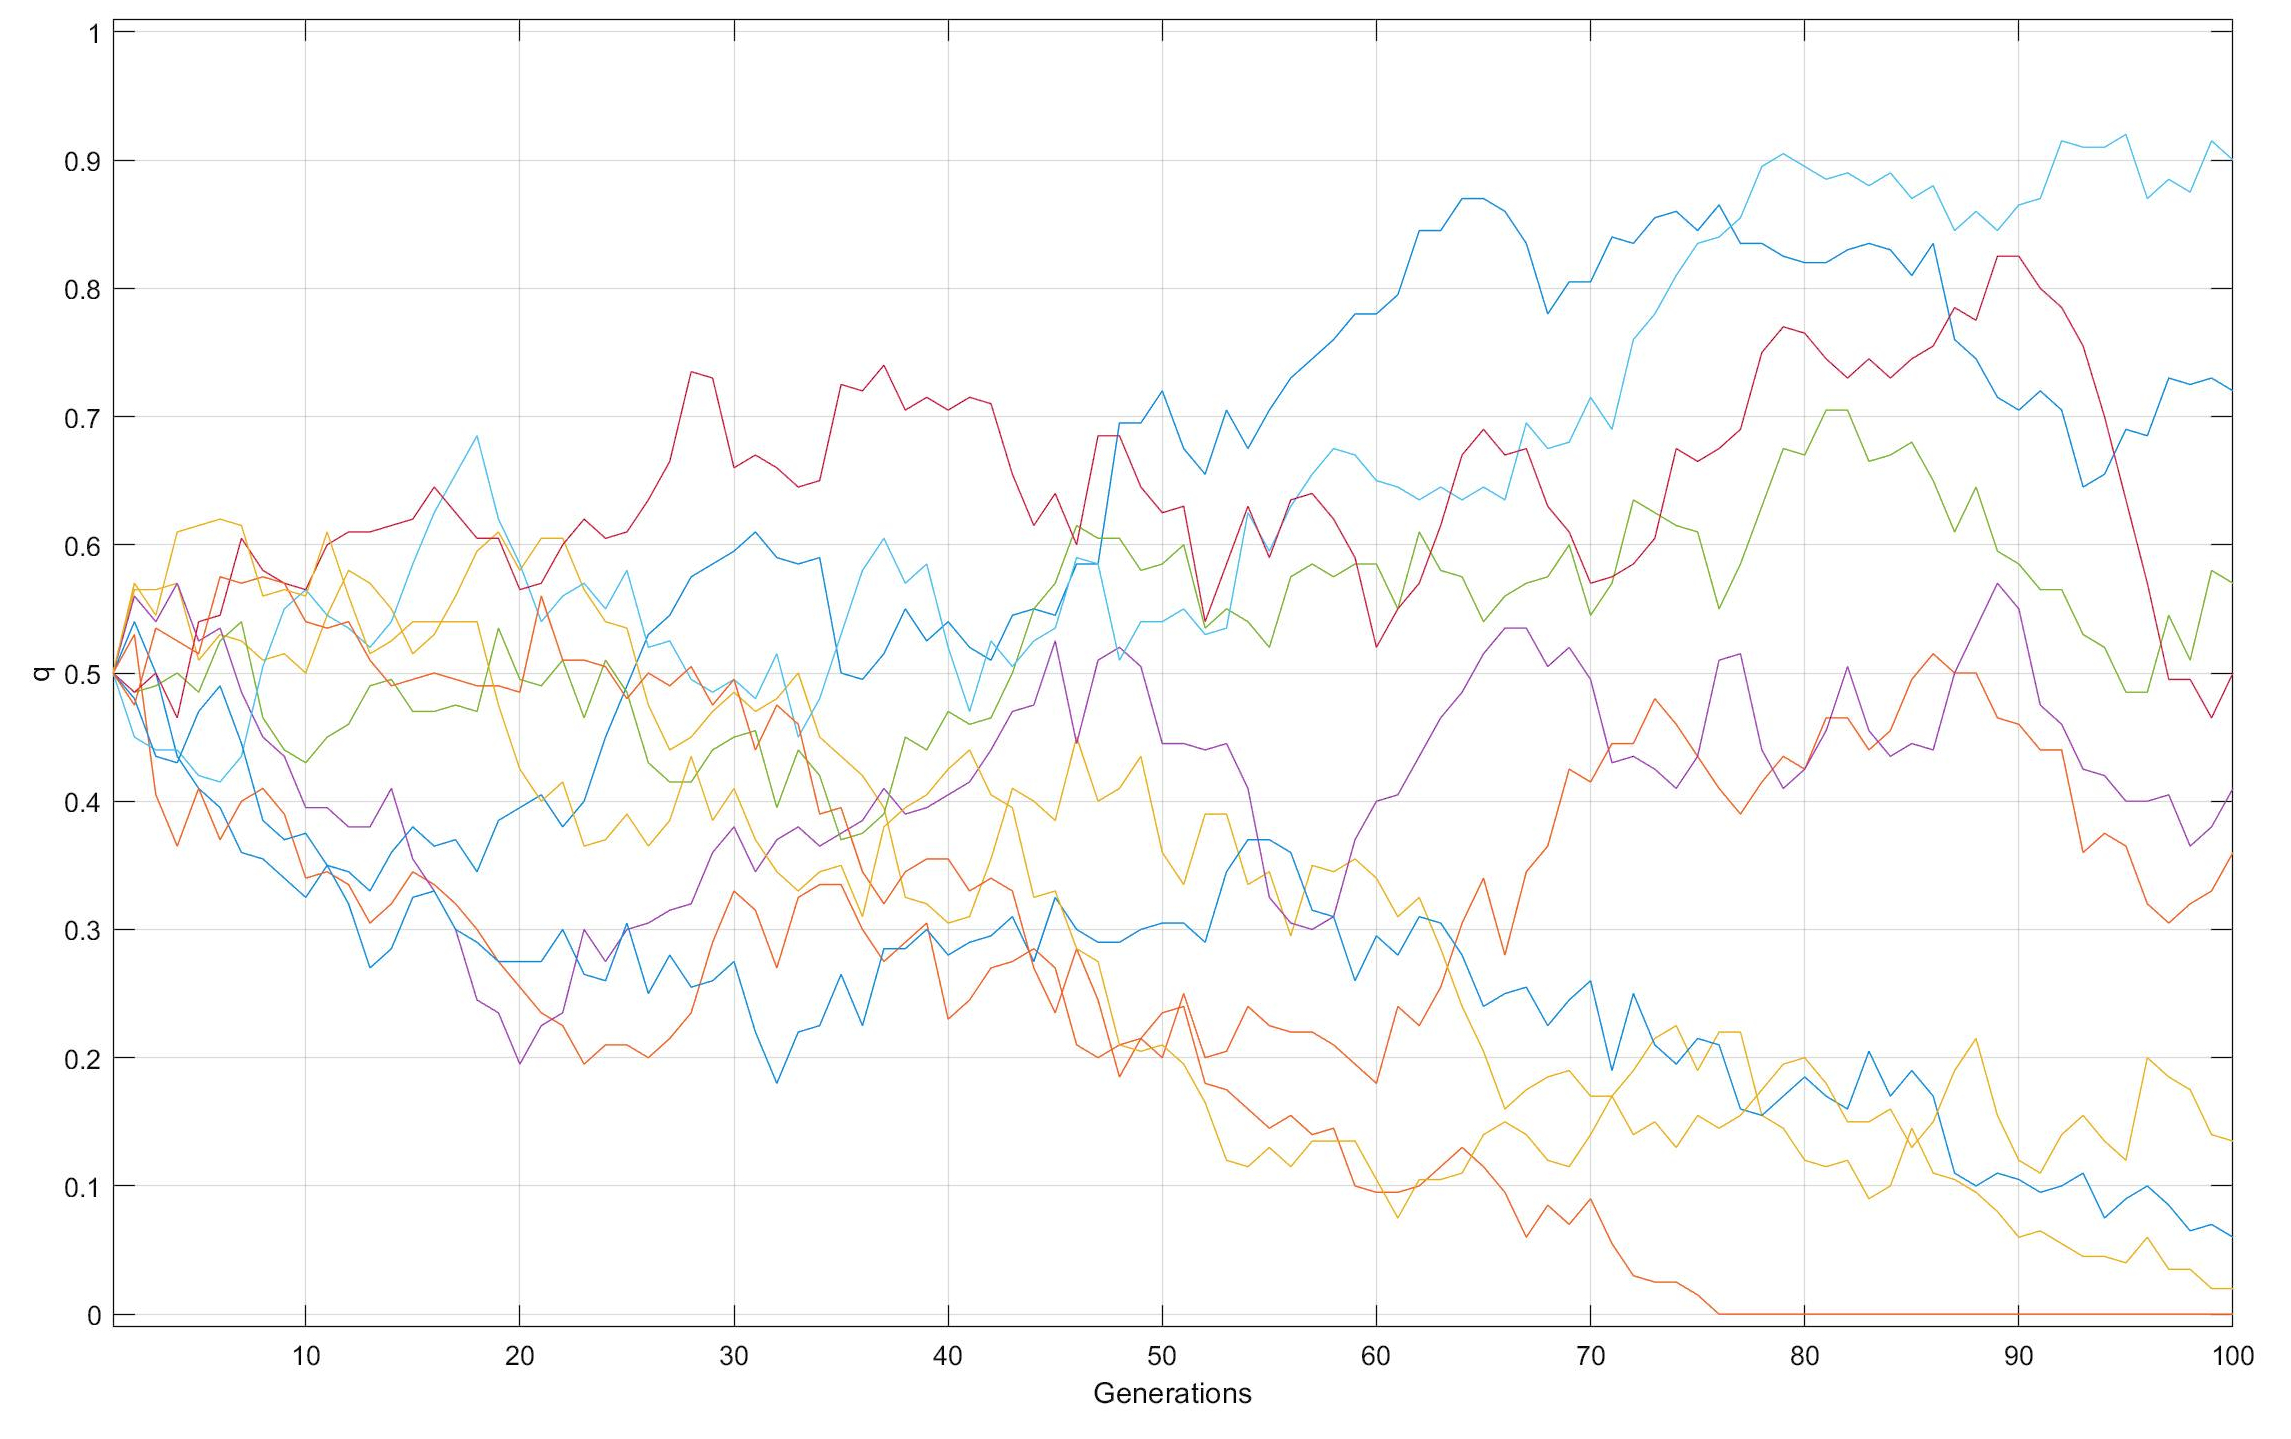
with N = 20 [top] or 100 [bottom]
individuals, f(B) diverges at random over time from
the starting value. The divergence in more rapid among smaller
populations than larger. With N = 20, eight
populations have gone to either loss (q = 0.0)
(n = 4) or fixation (q = 1.0) (n = 4)
after 100 generations, whereas with N = 100 after 100
generations, all of the populations save one retain both
alleles, in the range of q = 0.01 ~ 0.90.
Allele frequencies continue to vary at random so long as 0 < q < 1: q = 0.0 or 1.0 are absorbing barriers, which once reached end further change. Fate of q in a population is not predictable: between g = 70 & 100 with N = 100, dark orange q goes from 0.70 to 0.15, and light green q from 0.10 to 0.80
HOMEWORK: Repeat the simulations with the MatLab program WriFish.m with 10 populations @ of N = 100 or 1,000 or 10,000 individuals, over 1,000 generations. Compare the visual variance, as above. Note any loss or fixation events.