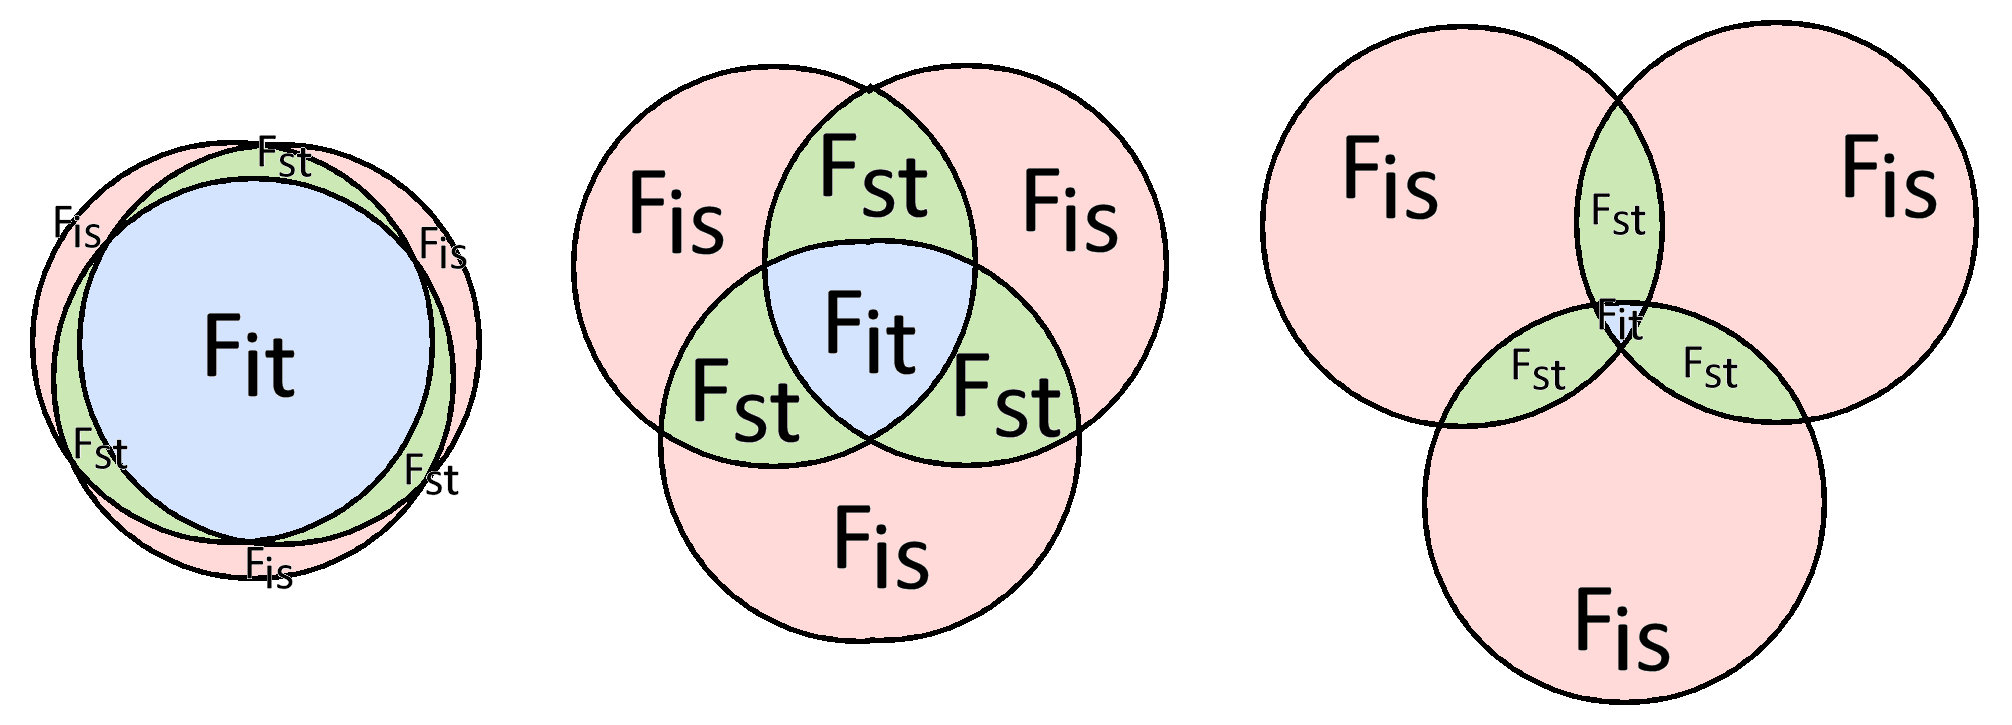
Conceptual model of hierarchical F-statistics
F-statistics
partition genetic structure (measured as variance)
among individuals within sub-populations
with respect to the total population. Each circle
represents a sub-population: for simplicity, the
sub-populations are all the same size. In the middle
diagram, the fraction of the total variance that in occurs
among individuals in each sub-population
is shown in pink, and the average over
all sub-populations is Fis.
The fraction of the total variance that occurs in all
sub-populations with respect to the total
is shown in blue, and the average is Fit. The
fraction of the total variance that is shared between
pairs of sub-populations is shown in green, and the
average over all combinations is Fst.
The relative magnitude of F-statistics depends on the extent to which individuals are structured in the hierarchy of individuals within sub-populations, and sub-populations within the total. In the right-hand diagram, most of the genetic variance occurs within individual population, and very little in the total, so Fis > Fst >> Fit. In the left-hand diagram, the sub-populations are nearly identical, and the variance occurs in the total Fit, so Fit > Fst ~ Fis.
These three models show symmetrical partitions among all three sub-populations. Alternative models can be drawn with circles of different size, with variable overlap, such that Fst becomes the most useful statistic to describe structure.
Figure & Text material © 2024 by Steven M. Carr