Die roll simulation of the Exponential / Taxi Cab Function
Use the RANDOM function of Excel as
A1 = RANDOM(1,6) which returns a random integer
between 1 & 6. Generate 1,200 random integers in rows A1-A1200.
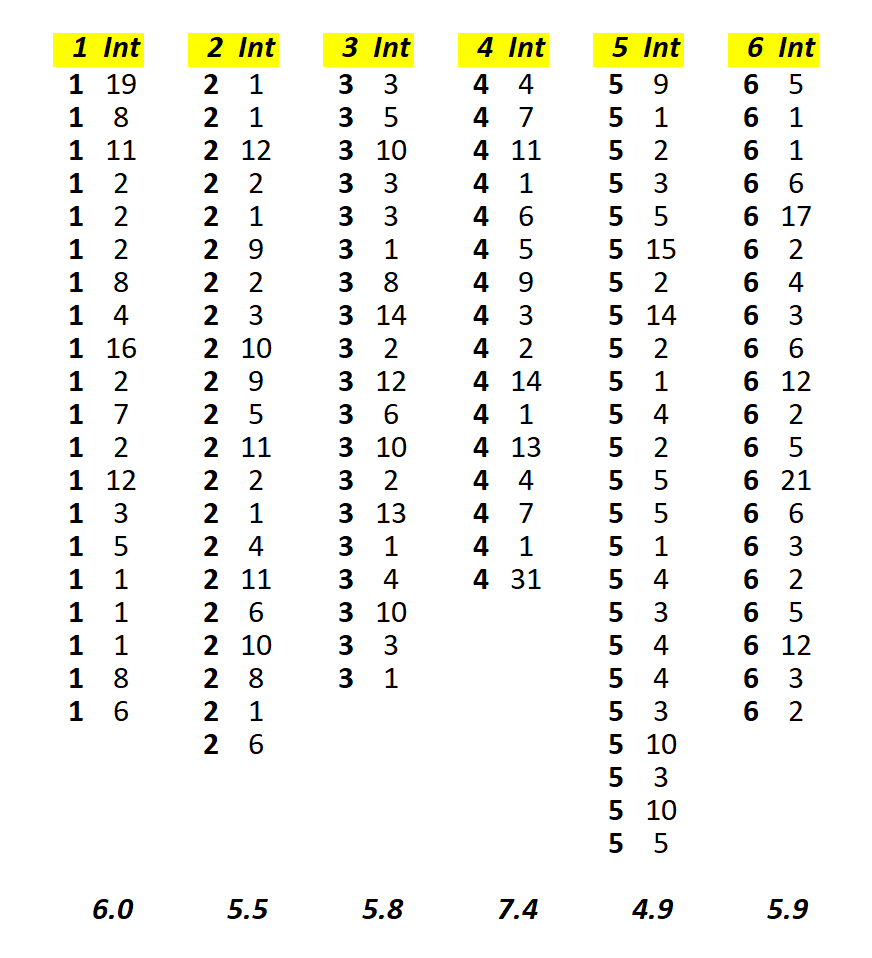
Sort the data by row (= roll) number and roll value (1 - 6).
Determine the interval between successive rolls of values 1
- 6. The distributions for each value will follow the Taxi Cab (Exponential) Function with a
mean of 6, and the aggregate 6 x 1,200 = 7,200
values will approximate it even more closely (the grand mean
here is 5.92).
Figure & Text material © 2022 by Steven M. Carr