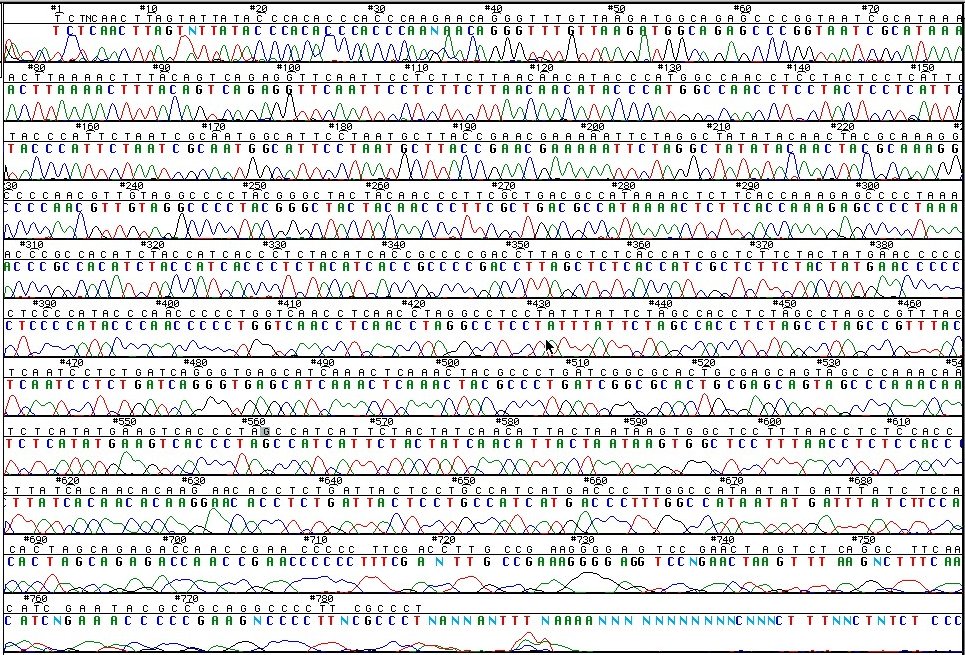
Chromatogram from an automated DNA sequencer
The
computer
scans
vertically through each
lane of the gel file, and converts the pattern of bands to an
individual
chromatogram with a series of "peaks"
corresponding to each of the
bands in the DNA
sequence as it passes the reader. These are shown as the
pseudo-colors
A
C G
& T. DNA
migration slows
over the course of the electrophoresis, and multiple bases
towards the
end may appear as a single broad band instead of discrete
"peaks". This
phenomenon is similar to the compression that occurs at the
top of an
autoradiograph. The data are presented in two lines:
the lower the original calls of the computer, and the upper a
line editable by the user. In
this experiment, automatic
base calling is 100% accurate to position 684 [a
double-wide TT peak is
corrected to a single T]
and >98% accurate to
the
end of the DNA template at 787 bases.
Manual
editing produces effectively 100% accuracy.