 |
TEACHER STRESS IN ONE SCHOOL DISTRICT OF NEWFOUNDLAND
AND LABRADOR: A PILOT STUDY
Lynda J. Younghusband
Faculty of Education
Across the country in all types of occupations people are working harder, longer than ever and with less job security. Radio, television and newspapers report that job related back pain, headaches, depression, heart disease, and burnout are on the rise. A recent national survey of Canadian employees found that almost half experienced a "great deal" of stress at work, a quarter of them to the point of it making them sick (Globe and Mail, May 17,2000). Workplace stress is the most common form of stress according to The Heart and Stroke Foundation. In their annual Report Card on Canadian Health, released February 02, 2000, the Foundation found that "close to half of all adults age 30 and over are overwhelmed by either their jobs, families or finances". "These results should serve as a wakeup call for all Canadians given that one in two adult Canadians report being stressed on a frequent basis. We now know that stress, particularly in the workplace, wreaks havoc on the circulatory system and can contribute to a heart attack or worse" (Dr. Rob Nolan as cited in The Telegram, February 13, 2000).
Stress has been said to be the worst health problem teachers have to contend with (Robert Sylwester as cited in R.C. Newell, 1979; Wisniewski and Gargiulo, 1997). The physiological responses to long-term stress are many; elevated blood pressure and other circulatory problems contributing to heart attack, headaches, weight loss, and lethargy are but some. Psychological responses to stress may manifest themselves as depression, nervousness, anxiety, psychosomatic complaints, emotional exhaustion and sleep disturbances.
Frequent and prolonged periods of stress may produce feelings of emotional exhaustion, a reduction in personal accomplishment, and a sense of professional failure and contribute to a condition often referred to as "burnout". When stress reaches the burnout level, energies are directed to basic survival; getting through the day becomes first priority.
A time-work study of Nova Scotia teachers (1999) found that the average work week of teachers was 50 hours. Eighty percent of teachers surveyed felt rushed every day, 67% reported they cut back on sleep to gain time, and 70% worried about the lack of time for family and friends. They reported high stressors to be: coping with changing job demands, increased paper work, increased work-related meetings and developing, implementing, reviewing and evaluating Individual Student Support Plans (ISSPs).
While there is some degree of strain (the result of stress) in all occupational settings, the level of stress and strain among teachers is not a new concern ( Kelly and Berthelsen, 1995; Kryiacou and Sutcliffe, 1978). Hunter wrote "air traffic control, surgery and teaching are probably three of the most potentially stressful occupations in the world...in them people are responsible for functioning in learned patterns yet must also possess on-their-feet, high-speed thinking and decision-making skills to handle the unexpected situations triggered by variance of humans and the caprice of nature" (Hunter, 1977, p. 122).
Selye, a pioneer in the study of stress, described stress as "the rate at which we live at any moment...anything pleasant or unpleasant that speeds up the intensity of life causes a temporary increase in stress" (Selye, 1974, p.2). "Occupational stress arises from a discrepancy between the teacher's work needs, values, and expectations and the failure of the work environment to provide occupational rewards, job demands and the capacity of the worker to meet these requirements" (Cooper, 1981, p.175)
Stress is a developmental process beginning in the pre-professional phase of student teaching. During the first five years of teaching a slow but steady increase in emotional exhaustion is reported. Further, the cumulative effects of stress influence a teacher's commitment to remain in the profession. Teachers who work with emotionally/behaviourally disturbed students are at a high risk of leaving the classroom, with attrition rates approximately six times that of other special educators (Wisniewski and Gargiulo, 1997).
The stress level of teachers in Newfoundland and Labrador has not been studied since the early 1980's when Kendell investigated stress factors and levels of stress as perceived by regular classroom teachers. The most stressful issues reported at that time were:
- time management
- parent/teacher relations
- intrapersonal conflicts
(Kendell, S.E., 1983)
Conversations with teachers and with staff at Newfoundland and Labrador Teachers' Association over the past year indicated stress is a growing problem and a concern that should be investigated. Accordingly, a pilot study was conducted in the spring of 2000 to develop methods for examining the levels of teacher stress and to determine and compare the levels of stress in male and female teachers in elementary, junior and senior high schools.
Subjects and Procedure
One hundred and ninety-eight teachers in one Newfoundland and Labrador school district were surveyed to obtain their report of occupational stresses, strains and coping behaviour using S.H. Osipow's (1998) Occupational Stress Inventory (OSI-R). One hundred teachers responded which constitutes a 51% response rate. The sample was composed of primary-elementary, junior high and senior high schools in both rural and urban areas. Participants ranged in age from 27-54 years, the mean age being 41 years.
Surveys were delivered to 14 schools in April 2000 and Principals were asked to distribute these to every second teacher on staff. Participants were informed in a cover letter that this was a pilot study to determine the level of stress among teachers. It was stated clearly that this questionnaire was anonymous and that there was no way in which individuals or schools could be identified. This cover letter, instructions for completion and a stamped, self-addressed return envelope were included with each survey. One follow up letter addressed to all teachers in each school reminded teachers to complete the survey. The surveys were analysed using the Statistical Package for Social Sciences (SPSS).
Measures
The Osipow (1998) Stress Inventory Revised Edition (OSI-R) was self-administered by the teachers. The OSI-R contains 140 statements about a person's work or personal life and comprises three separate scales: occupational stress (ORQ), personal strain (PSQ), and coping resources (PRQ). Each question in the scale is based on a five-point Likert scale ranging from rarely or never true (1) to true most of the time (5).
The ORQ, measuring the amount of stress stemming from the participant's work environment, has six subscales of ten items each (Role Overload, Role Insufficiency, Role Ambiguity, Role Boundary, Responsibility, and Physical Environment). According to Osipow (1988), Role Overload measures the degree to which the demands of the job exceed the resources (personal and institutional). Role Insufficiency measures the degree to which a teacher's training, education, skills, and experience are appropriate to his/her work. Role Ambiguity measures the degree to which a teacher feels clear about priorities, expectations, and evaluation standards. Role Boundaries measures the degree to which a teacher experiences conflicting role demands and loyalties at work. Responsibility measures the level of responsibility a teacher feels for his/her own performance and the well-being of his/her colleagues. Physical Environment measures whether a teacher is exposed to extreme physical conditions.
The PSQ includes four subscales of 10 items each. Occupational stressors exhibit themselves as vocational, physical, interpersonal, and psychological strain. Osipow (1998) states that vocational strain measures the extent to which a participant has problems in work quality or output. Attitudes to work are also measured. Psychological strain measures the degree of psychological adjustment and/or mood problems a teacher reports. Interpersonal strain measures the degree to which interpersonal relationships are disrupted. Physical strain measures poor self-care habits and physical illness ailments.
The PRQ, a measure of coping, contains four subscales of 10 items each (Recreation, Self-Care, Social Support, and Rational/Cognitive Coping). Osipow developed this section to measure the coping mechanisms used by a participant (in this case, teacher). Recreation measures the degree to which a teacher involves him/herself in regular recreational activities such as sports and hobbies and the amount of pleasure and relaxation gained from these activities. Self-care measures the degree to which a teacher takes care of his health (diet, exercise and sleep). Social supports measure the degree of support a teacher feels around him from family, friends, and peers. Rational/Cognitive Coping measures the degree of cognitive skills possessed by a teacher and how he/she uses them to deal with work-related stresses. Osipow includes organizing work-loads, setting priorities, and the ability to recognize and then attempt to solve problems.
Here are some selected samples of items:
"I am expected to do more work than is reasonable" (role overload);
"Lately, I have been feeling anxious" (psychological strain);
"If I need help at work I know who to approach" (social support).
Results
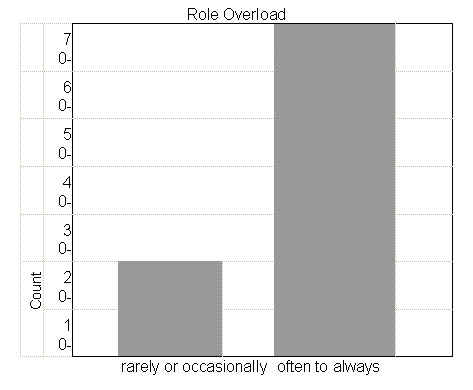
The purpose of this pilot study was to assess the level of stress among teachers in one school district. The results supported the hypothesis that teachers are feeling a high level of stress due to their occupation and highlight serious concerns. The greatest stressor was found to be Role Overload. As shown in Diagram 1, 74% of teachers feel stress due to role overload often to most of the time; 26% rarely or occasionally.
Diagram 1
|
rarely or occasionally often to always
Ninety-five percent of the teachers described their job responsibilities as increasing (Q2) yet 74% felt they did not have the resources they need (RQ5). Table 1 outlines the stress experienced because of this role overload.
Table 1: Percentage of Teachers Responding to the Individual Items Related to Role Overload
| Rarely or Never | Occasionally | Often | Usually | Most of the Time | |
| Q1: At work I am asked to do too many different tasks in too little time. | 2.0 | 28.0 | 30.0 | 23.0 | 17.0 |
| Q2: I feel that my job responsibilities are increasing. | 0.0 | 5.0 | 12.0 | 28.0 | 55.0 |
| Q3: I am expected to perform tasks on my job for which I have never been trained. | 12.0 | 29.0 | 31.0 | 16.0 | 12.0 |
| Q4: I have to take work home with me. | 0.0 | 5.0 | 7.0 | 6.0 | 82.0 |
| RQ5: I do not have the resources I need to get my job done. | 6.0 | 20.0 | 29.0 | 38.0 | 7.0 |
| RQ6: I am not good at my job. | 55.0 | 41.0 | 4.0 | 0.0 | 0.0 |
| Q7: I work under tight deadlines. | 1.0 | 13.0 | 26.0 | 35.0 | 25.0 |
| Q8: I wish that I had more help to deal with the demands placed upon my at work. | 3.0 | 16.0 | 27.0 | 35.0 | 19.0 |
| Q9: My job requires me to work in several equally important areas at once. | 7.1 | 13.3 | 22.4 | 29.6 | 27.6 |
| Q10: I am expected to do more work than is reasonable. | 8.0 | 27.0 | 26.0 | 29.0 | 10.0 |
Note: Hereafter, questions with R in front indicate that they were recoded.
The vocational strain caused by this stress is measured in attitudes toward work and the extent to which the individual is having problems in work quality or output. As can be seen in Table 2, 31% of the teachers feel they are not able to get much work done, (Q1), 29% dread going to work lately, (Q2), 46% do not find work interesting or exciting, (Q8), and 38% cannot concentrate on the things they need to at work (Q9).
Table 2: Percentage of Teachers Responding to the Individual Items Related to Vocational Strain Construct
| Rarely or Never | Occasionally | Often | Usually | Most of the Time | |
| Q1: I don't seem to be able to get much done at work. | 36.4 | 32.3 | 25.3 | 3.0 | 3.0 |
| Q2: Lately, I dread going to work. | 45.5 | 25.3 | 16.2 | 7.1 | 6.1 |
| Q3: I am bored with my work. | 52.5 | 26.3 | 12.1 | 5.1 | 4.0 |
| Q4: I find myself getting behind in my work lately. | 24.2 | 44.4 | 12.1 | 12.1 | 7.1 |
| Q6: The quality of my work is not good. | 39.4 | 42.4 | 12.1 | 4.0 | 2.0 |
| Q7: Recently I have been absent from work. | 74.7 | 14.1 | 8.1 | 1.0 | 2.0 |
| Q8: I don't find my work interesting and/or exciting. | 18.4 | 35.7 | 22.4 | 15.3 | 8.2 |
| Q9: I cannot concentrate on the things I need to at work. | 19.2 | 42.4 | 18.2 | 12.1 | 8.1 |
| Q10: I make errors or mistakes in my work. | 43.4 | 50.5 | 4.0 | 1.0 | 1.0 |
| Note: Question 5 was dropped from the scale because it was not applicable. | |||||
Some interesting, yet disturbing discoveries came to light in the Role Ambiguity domain (Appendix A). Fifty-eight percent of the teachers said that they are rarely or only occasionally provided with useful feedback about their performance by their administration and 29% do not know the basis on which they are evaluated. Many of the teachers surveyed clearly felt unsure of where they fit in the local educational system, are not clear who is 'captaining the ship', and feel considerable conflict between what they are expected to do and what they think is right or proper (see Appendix A, Role Boundary). They feel the amount of work expected of them is unreasonable while at the same time feeling a high level of responsibility and worry about meeting these job responsibilities (Appendix A, Responsibility). According to Wisniewsk and Gargiulo (1997), when performance expectations are established for teachers but relevant resources are not provided, a degree of uncertainty is experienced by these teachers. "This uncertainty becomes an important source of anxiety and stress that ultimately influences a teacher's commitment to the school and profession."
The physical working environment can add to or help decrease one's stress level. In this case, (Table 3), teachers report they are working in high noise levels, high levels of dust, temperature extremes, and bright lights. Added to this, one-in-ten feel that their job as a teacher is physically dangerous. Is it any wonder, given these all these facts, that , as discussed earlier, 29% reported dreading going to work lately?
Table 3: Percentage of Teachers Responding to the Individual Items Related to Physical Environment
| Rarely or Never | Occasionally | Often | Usually | Most of the Time | |
| % | % | % | % | % | |
| Q51: In my job I am exposed to high levels of noise. | 20.0 | 21.0 | 18.0 | 19.0 | 22.0 |
| Q53: In my job I am exposed to high levels of dust. | 27.0 | 20.0 | 19.0 | 8.0 | 26.0 |
| Q54: In my job I am exposed to temperature extremes. | 36.0 | 17.0 | 21.0 | 11.0 | 15.0 |
| Q55: In my job I am exposed to bright light. | 47.0 | 10.0 | 17.0 | 17.0 | 9.0 |
| Q56: My job is physically dangerous. | 72.0 | 18.0 | 5.0 | 3.0 | 2.0 |
| Q57: I have an erratic work schedule. | 55.0 | 21.0 | 11.0 | 8.0 | 5.0 |
| Q58: I work all by myself. | 49.0 | 15.0 | 20.0 | 9.0 | 7.0 |
| Q59: In my job I am exposed to unpleasant odours. | 53.0 | 30.0 | 5.0 | 9.0 | 3.0 |
The interpersonal strain (Table 4) caused by this occupational stress is apparent as teachers report lately doing things by themselves instead of with others and finding that lately their relationships are not good. Forty-four percent indicated that recently they find they need time to themselves to work out their problems. Of great concern are those 14% (or 1 in 7) who state that they have been withdrawing from people lately.
Table 4: Percentage of Teachers Responding to the Individual Items Related to Interpersonal Strain
| Rarely or Never | Occasionally | Often | Usually | Most of the Time | |
| % | % | % | % | % | |
| Q21: I wish I had more time to spend with close friends. | 4.1 | 20.4 | 18.4 | 31.6 | 25.5 |
| Q22: I often quarrel with the person closest to me. | 36.7 | 44.9 | 9.2 | 7.1 | 2.0 |
| Q23: I often argue with friends. | 72.4 | 18.4 | 7.1 | 1.0 | 1.0 |
| Q25: Lately I do things by myself instead of with other people. | 26.5 | 38.8 | 14.3 | 13.3 | 7.1 |
| Q27: Lately I find my relationships aren't good. | 26.5 | 32.7 | 33.7 | 4.1 | 3.1 |
| Q28: I find that I need time to myself to work out my problems. | 18.4 | 37.8 | 14.3 | 19.4 | 10.2 |
| Q29: Lately I am worried about how others at work view me. | 45.9 | 33.7 | 13.3 | 4.1 | 3.1 |
| Q30: I have been withdrawing from people lately. | 50.0 | 35.7 | 9.2 | 3.1 | 2.0 |
Forty-four percent of the respondents feel tense and 34% report having difficulty falling asleep. Fifty-six percent of respondents feel unwell much or most of the time! (Refer to Appendix A, Physical Strain).
Considering the above statistics, indicating feelings of stress and strain due to a heavy workload in a physically unhealthy environment, without the support or resources they feel they need, it is easy to understand why 79% of these teachers rarely go to a movie, theatre or concert. They have not the time or the mental or physical energy required. Worrisome are the 16% who report using excessive amounts of alcohol and the 39% who rarely get the sleep they feel they need (see Appendix A Self Care).
The results of this pilot study of one school district support Kyriacou's definition of teacher stress as "the experience by a teacher of unpleasant emotions, such as tension, frustration, anger and depression resulting from aspects of his work as a teacher" and demonstrate that teacher stress is a serious problem in this province. This problem must be attended to if we want to improve working conditions for teachers and ensure our students a quality education. The solutions will not be simple but perhaps preventing the stress which leads to teacher burnout is one of our biggest challenges for the future of education in Newfoundland and Labrador.
Appendix A
Role Overload
| Rarely or Never | Occasionally | Often | Usually | Most of the Time | |
| Q1: At work I am asked to do too many different tasks in too little time. | 2.0 | 28.0 | 30.0 | 23.0 | 17.0 |
| Q2: I feel that my job responsibilities are increasing. | 0.0 | 5.0 | 12.0 | 28.0 | 55.0 |
| Q3: I am expected to perform tasks on my job for which I have never been trained. | 12.0 | 29.0 | 31.0 | 16.0 | 12.0 |
| Q4: I have to take work home with me. | 0.0 | 5.0 | 7.0 | 6.0 | 82.0 |
| RQ5: I do not have the resources I need to get my job done. | 6.0 | 20.0 | 29.0 | 38.0 | 7.0 |
| RQ6: I am not good at my job. | 55.0 | 41.0 | 4.0 | 0.0 | 0.0 |
| Q7: I work under tight deadlines. | 1.0 | 13.0 | 26.0 | 35.0 | 25.0 |
| Q8: I wish that I had more help to deal with the demands placed upon my at work. | 3.0 | 16.0 | 27.0 | 35.0 | 19.0 |
| Q9: My job requires me to work in several equally important areas at once. | 7.1 | 13.3 | 22.4 | 29.6 | 27.6 |
| Q10: I am expected to do more work than is reasonable. | 8.0 | 27.0 | 26.0 | 29.0 | 10.0 |
Role Insufficiency
| Rarely or Never | Occasionally | Often | Usually | Most of the Time | |
| % | % | % | % | % | |
| Q11: My career is progressing about as I hoped it would. | 7.0 | 24.0 | 25.0 | 22.0 | 22.0 |
| Q12: My job fits my skills and interests. | 1.0 | 10.0 | 18.0 | 40.0 | 31.0 |
| Q13: I am bored with my job. | 7.0 | 1.0 | 12.0 | 28.0 | 52.0 |
| Q14: I feel I have enough responsibility in my job. | .0 | 3.0 | 19.0 | 20.0 | 58.0 |
| Q15: My talents are being used in my job. | 1.0 | 11.0 | 21.0 | 41.0 | 26.0 |
| Q16: My job has a good future. | 11.0 | 26.0 | 27.0 | 20.0 | 16.0 |
| Q17: I am able to satisfy my needs for success and recognition in my job. | 12.0 | 23.0 | 29.0 | 28.0 | 7.0 |
| Q18: I don't feel over qualified. | 2.0 | 9.0 | 18.0 | 31.0 | 40.0 |
| Q19: I learn new skills in my work. | 13.0 | 28.0 | 32.0 | 15.0 | 12.0 |
| Q20: I don't have to perform tasks below my ability. | 6.0 | 7.0 | 19.0 | 41.0 | 27.0 |
Role Ambiguity
| Rarely or Never | Occasionally | Often | Usually | Most of the Time | |
| % | % | % | % | % | |
| Q21: My supervisor provides me with useful feedback about my performance. | 26.0 | 32.0 | 22.0 | 10.0 | 10.0 |
| Q22: It is clear to me what I have to do to get ahead. | 11.0 | 21.0 | 26.0 | 26.0 | 16.0 |
| Q23: I am certain about what I am supposed to accomplish. | 2.0 | 5.0 | 11.0 | 33.0 | 49.0 |
| Q24: When faced with several tasks I know which should be done first. | 2.0 | 3.0 | 14.0 | 45.0 | 36.0 |
| Q25: I know where to begin a new product when it is assigned to me. | 1.0 | 8.0 | 7.0 | 53.0 | 31.0 |
| Q26: My supervisor asks for one thing but really ants another. | 3.0 | 4.0 | 10.0 | 20.0 | 63.0 |
| Q27: I understand what is acceptable personal behaviour in my job (e.g., dress, interpersonal relations, etc.) | 3.0 | 1.0 | 5.0 | 17.0 | 74.0 |
| Q28: The priorities of my job are clear to me. | 1.0 | 3.0 | 19.0 | 35.0 | 42.0 |
| Q29: I have a clear understanding of how my boss wants me to spend my time. | 4.0 | 6.0 | 28.0 | 29.0 | 33.0 |
| Q30: I know the basis on which I am evaluated. | 11.0 | 18.0 | 21.0 | 24.0 | 26.0 |
Role Boundary
| Rarely or Never | Occasionally | Often | Usually | Most of the Time | |
| % | % | % | % | % | |
| Q31: I feel conflict between what my employer expects me to do and what I think is right or proper.. | 40.0 | 31.0 | 16.0 | 8.0 | 5.0 |
| Q32: I feel caught between factions at work. | 39.0 | 39.0 | 14.0 | 7.0 | 1.0 |
| Q33: I have more than one person telling me what to do. | 51.0 | 34.0 | 8.0 | 6.0 | 1.0 |
| RQ34: I don't know where I fit in my organization. | 27.0 | 40.0 | 27.0 | 4.0 | 2.0 |
| RQ35: I don't feel good about the work I do. | 32.0 | 35.0 | 20.0 | 10.0 | 3.0 |
| Q36: My supervisors have conflicting ideas about what I should be doing. | 57.0 | 25.0 | 12.0 | 5.0 | 1.0 |
| RQ38: It is not clear who really runs things where I work. | 30.0 | 30.0 | 11.0 | 17.0 | 12.0 |
| Q39: I have divided loyalties on my job.. | 46.0 | 29.0 | 14.0 | 8.0 | 3.0 |
Note: Questions 37 and 40 were dropped from the scale because they were not applicable.
Responsibility
| Rarely or Never | Occasionally | Often | Usually | Most of the Time | |
| % | % | % | % | % | |
| Q41: I deal with more people during the day than I prefer. | 32.0 | 27.0 | 15.0 | 8.0 | 18.0 |
| Q42: I spend time concerned with the problems others at work bring to me. | 26.0 | 37.0 | 19.0 | 13.0 | 5.0 |
| Q43: I am responsible for the welfare of subordinates. | 45.0 | 20.0 | 16.0 | 6.0 | 13.0 |
| Q44: People on-the-job look to me for leadership. | 13.0 | 28.0 | 27.0 | 17.0 | 15.0 |
| Q45: I have on-the-job responsibility for the activities of others. | 39.0 | 14.0 | 11.0 | 16.0 | 20.0 |
| Q46: I worry about whether the people who work for/with me will get things done properly. | 35.0 | 30.0 | 18.0 | 12.0 | 5.0 |
| Q47: My job requires me to make important decisions. | 7.0 | 9.0 | 28.0 | 25.0 | 31.0 |
| Q48: If I make a mistake in my work, the consequences for others can be pretty bad. | 23.0 | 29.0 | 18.0 | 18.0 | 12.0 |
| Q49: I worry about meeting my job responsibilities. | 21.0 | 29.0 | 23.0 | 18.0 | 9.0 |
Physical Environment
| Rarely or Never | Occasionally | Often | Usually | Most of the Time | |
| % | % | % | % | % | |
| Q51: On my job I am exposed to high levels of noise. | 20.0 | 21.0 | 18.0 | 19.0 | 22.0 |
| Q53: On my job I am exposed to high levels of dust | 27.0 | 20.0 | 19.0 | 8.0 | 26.0 |
| Q54: On my job I am exposed to temperature extremes. | 36.0 | 17.0 | 21.0 | 11.0 | 15.0 |
| Q55: On my job I am exposed to bright light. | 47.0 | 10.0 | 17.0 | 17.0 | 9.0 |
| Q56: My job is physically dangerous. | 72.0 | 18.0 | 5.0 | 3.0 | 2.0 |
| Q57: I have an erratic work schedule. | 55.0 | 21.0 | 11.0 | 8.0 | 5.0 |
| Q58: I work all by myself. | 49.0 | 15.0 | 20.0 | 9.0 | 7.0 |
| Q59: On my job I am exposed to unpleasant odours | 53.0 | 30.0 | 5.0 | 9.0 | 3.0 |
Note: Questions 37 and 40 were dropped from the scale because they were not applicable.
Vocational Strain
| Rarely or Never | Occasionally | Often | Usually | Most of the Time | |
| % | % | % | % | % | |
| Q1: I don't seem to be able to get much done at work. | 36.4 | 32.3 | 25.3 | 3.0 | 3.0 |
| Q2: Lately, I dread going to work. | 45.5 | 25.3 | 16.2 | 7.1 | 6.1 |
| Q3: I am bored with my work. | 52.5 | 26.3 | 12.1 | 5.1 | 4.0 |
| Q4: I find myself getting behind in my work lately. | 24.2 | 44.4 | 12.1 | 12.1 | 7.1 |
| Q6: The quality of my work is not good. | 39.4 | 42.4 | 12.1 | 4.0 | 2.0 |
| Q7: Recently I have been absent from work. | 74.7 | 14.1 | 8.1 | 1.0 | 2.0 |
| Q8: I don't find my work interesting and/or exciting. | 18.4 | 35.7 | 22.4 | 15.3 | 8.2 |
| Q9: I cannot concentrate on the things I need to at work. | 19.2 | 42.4 | 18.2 | 12.1 | 8.1 |
| Q10: I make errors or mistakes in my work. | 43.4 | 50.5 | 4.0 | 1.0 | 1.0 |
| Note: Question 5 was dropped from the scale because it was not applicable. | |||||
Psychological Strain
| Rarely or Never | Occasionally | Often | Usually | Most of the Time | |
| % | % | % | % | % | |
| Q11: Lately I am easily irritated | 20.2 | 40.4 | 20.2 | 9.1 | 10.1 |
| Q12: Lately I have been depressed. | 47.5 | 27.3 | 17.2 | 4.0 | 4.0 |
| Q13: Lately I have been feeling anxious. | 35.4 | 33.3 | 17.2 | 10.1 | 4.0 |
| Q14: I have been unhappy lately. | 13.1 | 28.3 | 25.3 | 28.3 | 5.1 |
| Q15: So many thoughts run through my head at night that I have trouble falling asleep. | 36.4 | 28.3 | 14.1 | 14.1 | 7.1 |
| Q16: Lately I respond badly in situations that normally wouldn't bother me. | 46.5 | 30.3 | 12.1 | 9.1 | 2.0 |
| Q17: I find myself complaining about little things. | 30.3 | 37.4 | 17.2 | 12.1 | 3.0 |
| Q18: Lately I have been worrying. | 35.4 | 25.3 | 22.2 | 13.1 | 4.0 |
| Q19: I don't have a good sense of humour. | 32.3 | 35.4 | 23.2 | 7.1 | 2.0 |
| Q20: Things aren't going as they should. | 14.1 | 22.2 | 41.4 | 18.2 | 4.0 |
Interpersonal Strain
| Rarely or Never | Occasionally | Often | Usually | Most of the Time | |
| % | % | % | % | % | |
| Q21: I wish I had more time to spend with close friends. | 4.1 | 20.4 | 18.4 | 31.6 | 25.5 |
| Q22: I often quarrel with the person closest to me. | 36.7 | 44.9 | 9.2 | 7.1 | 2.0 |
| Q23: I often argue with friends. | 72.4 | 18.4 | 7.1 | 1.0 | 1.0 |
| Q25: Lately I do things by myself instead of with other people. | 26.5 | 38.8 | 14.3 | 13.3 | 7.1 |
| Q27: Lately I find my relationships aren't good. | 26.5 | 32.7 | 33.7 | 4.1 | 3.1 |
| Q28: I find that I need time to myself to work out my problems. | 18.4 | 37.8 | 14.3 | 19.4 | 10.2 |
| Q29: Lately I am worried about how others at work view me. | 45.9 | 33.7 | 13.3 | 4.1 | 3.1 |
| Q30: I have been withdrawing from people lately. | 50.0 | 35.7 | 9.2 | 3.1 | 2.0 |
Physical Strain
| Rarely or Never | Occasionally | Often | Usually | Most of the Time | |
| % | % | % | % | % | |
| Q31: I have unplanned weight gains. | 52.0 | 23.5 | 10.2 | 8.2 | 6.1 |
| Q32: My eating habits are erratic. | 49.0 | 21.4 | 16.3 | 5.1 | 8.2 |
| Q33: I find myself drinking a lot lately. | 81.6 | 9.2 | 8.2 | 1.0 | .0 |
| Q34: Lately I have been tired. | 11.2 | 23.5 | 25.5 | 14.3 | 25.5 |
| Q35: I have been feeling tense. | 23.5 | 32.7 | 21.4 | 13.3 | 9.2 |
| Q36: I have trouble falling asleep. | 40.8 | 25.5 | 19.4 | 4.1 | 10.2 |
| Q37: I have aches and pains I cannot explain. | 50.0 | 21.4 | 9.2 | 8.2 | 11.2 |
| Q38: I eat the wrong foods. | 32.0 | 33.0 | 20.6 | 7.2 | 7.2 |
| Q39: I don't feel well. | 23.9 | 20.6 | 32.0 | 16.5 | 7.2 |
| Q40: I have lots of energy. | 6.2 | 19.6 | 24.7 | 26.8 | 22.7 |
Recreation
| Rarely or Never | Occasionally | Often | Usually | Most of the Time | |
| % | % | % | % | % | |
| Q1: When I need a vacation I take one. | 55.6 | 27.3 | 7.1 | 8.1 | 2.0 |
| Q2: I am able to do what I want to do in my free time. | 27.3 | 34.3 | 15.2 | 15.2 | 8.1 |
| Q3: On the weekends I spend time doing the things I enjoy most. | 9.1 | 45.5 | 23.2 | 18.2 | 4.0 |
| Q4: I watch TV often. | 15.2 | 10.1 | 22.2 | 32.3 | 20.2 |
| Q5: A lot of my free time is spent attending performances (e.g., sporting events, theatre, movies, concerts, etc.). | 39.4 | 39.4 | 11.1 | 2.0 | 8.1 |
| Q6: I spend a lot of my free time in participant activities (e.g., sports, music, painting, woodworking, sewing, etc.). | 32.3 | 33.3 | 11.1 | 16.2 | 7.1 |
| Q7: I set aside time to do the things I really enjoy. | 17.2 | 45.5 | 17.2 | 14.1 | 6.1 |
| Q8 When I'm relaxing I don't think about work. | 10.1 | 15.2 | 31.3 | 25.3 | 18.2 |
| Q8 I spend enough time in recreational activities to satisfy my needs. | 35.4 | 25.3 | 22.2 | 13.1 | 4.0 |
| Q10 I spend a lot of my free time on hobbies (e.g., collections of various kinds, etc.). | 42.4 | 37.4 | 17.2 | 3.0 | .0 |
Self-Care
| Rarely or Never | Occasionally | Often | Usually | Most of the Time | |
| % | % | % | % | % | |
| Q11: I am careful about my diet (e.g., eating regularly, moderately, and with good nutrition in mind). | 12.1 | 22.2 | 25.3 | 21.2 | 19.2 |
| Q12: I get regular physical check-ups. | 29.3 | 16.2 | 14.1 | 17.2 | 23.2 |
| Q13: I avoid excessive use of alcohol. | 7.1 | 9.1 | 8.1 | 17.2 | 58.6 |
| Q14: I exercise regularly (at least 20 minutes three times a week). | 25.3 | 20.2 | 18.2 | 8.1 | 28.3 |
| Q15: I practice "relaxation techniques". | 67.7 | 20.2 | 8.1 | 2.0 | 2.0 |
| Q16: I get the sleep I need. | 17.2 | 22.2 | 18.2 | 26.3 | 16.2 |
| Q17: I avoid eating or drinking things I know are unhealthy (e.g., coffee, tea, cigarettes, etc.). | 25.3 | 25.3 | 18.2 | 21.2 | 10.1 |
| Q18: I engage in meditation. | 81.8 | 10.1 | 4.0 | 3.0 | 1.0 |
| Q19: I practice deep breathing exercises a few minutes several times each day. | 82.8 | 10.1 | 5.1 | 2.0 | .0 |
| Q20: I floss my teeth regularly. | 27.3 | 18.2 | 19.2 | 16.2 | 19.2 |
Social Support
| Rarely or Never | Occasionally | Often |
Usually | Most of the Time | |
| % | % | % | % | % | |
| Q21: There is at least one person important to me who values me. | .0 | 5.1 | 5.1 | 8.1 | 81.8 |
| Q22: I have help with tasks around the house. | 8.1 | 14.1 | 15.2 | 20.2 | 42.4 |
| Q23: I have help with the important things that have to be done. | 6.1 | 17.2 | 20.2 | 23.2 | 33.3 |
| Q24: There is at least one sympathetic person with whom I can discuss my concerns. | 3.0 | 8.1 | 8.1 | 22.2 | 58.6 |
| Q25: There is at least one sympathetic person with whom I can discuss my work problems. | 3.0 | 8.1 | 12.1 | 18.2 | 58.6 |
| Q26: I feel I have at least one good friend I can count on. | 2.0 | 5.1 | 10.1 | 14.1 | 68.7 |
| Q27: I feel loved. | 3.0 | 6.1 | 6.1 | 16.2 | 68.7 |
| Q28: There is a person with whom I feel really close. | 2.0 | 5.1 | 9.1 | 18.2 | 65.7 |
| Q29: I have a circle of friends who value me. | 4.1 | 13.3 | 13.3 | 27.6 | 41.8 |
| Q30: If I need help at work, I know who to approach. | 4.0 | 8.1 | 16.2 | 27.3 | 44.4 |
Rational/Cognitive
| Rarely or Never | Occasionally | Often | Usually | Most of the Time | |
| % | % | % | % | % | |
| Q31: I am able to put my job out of my mind when I go home. | 25.3 | 18.2 | 24.2 | 20.2 | 12.1 |
| Q32: I feel that there are other jobs I could do besides my current one. | 12.1 | 21.2 | 19.2 | 19.2 | 28.3 |
| Q33: I periodically reexamine or reorganize my work style and schedule. | 12.1 | 33.3 | 31.3 | 18.2 | 5.1 |
| Q34: I can establish priorities for the use of my priorities. | 3.0 | 13.1 | 31.3 | 18.2 | 17.2 |
| Q35: Once they are set, I am able to stick to my priorities. | 2.0 | 18.2 | 27.3 | 31.3 | 21.2 |
| Q36: I have techniques to help avoid being distracted. | 14.1 | 24.2 | 27.3 | 28.3 | 6.1 |
| Q37: I can identify important elements of problems I encounter. | .0 | 8.1 | 28.3 | 43.4 | 20.2 |
| Q38: When faced with a problem I use a systematic approach. | 1.0 | 15.2 | 42.4 | 26.3 | 15.2 |
| Q39: When faced with the need to make a decision I try to think through the consequences of choices I might make. | .0 | 8.1 | 15.2 | 43.4 | 33.3 |
| Q40: I try to keep aware of important ways I behave and things I do. | 1.0 | 1.0 | 27.3 | 33.3 | 37.4 |
BIBLIOGRAPHY
Cooper, C.L. (1981). The Stress Check. Englewood Cliffs: Prentice Hall Inc., Toronto.
Globe and Mail (May 17, 2000).
Heart and Stroke Foundation (2000) [Available on-line www.heartandstroke.ca]
Hunter, M. (1977). Counterirritants to....teaching. Instructor, 87, 122-5.
Kendell, S.E. (1983). An Investigation into Stress Factors and Levels of Stress as Perceived by Regular Classroom Teachers of Newfoundland and Labrador. Unpublished Thesis, Memorial University.
Kryiacou, C. & Sutcliffe, J. (1978). Teacher Stress: Prevalence, Sources and Symptoms. British Journal of Educational Psychology, 48, 159-167.
Kryiacou, C. (1987). Teacher Stress and Burnout: An International Review. Educational Research, 29, 146-152.
Newell, R.C. (1979). Teacher Stress. American Teacher. December/January, 64.
Selye, H. (1974). Stress Without Distress. Hodder & Stroughton; London.
The Telegram (February 03, 2000). St. John's, Newfoundland.
Wisniewski, L. & Gargiulo, R. (1997). Occupational Stress and Burnout Among Special Educators: A Review of the Literature. The Journal of Special Education, 31, 325-346.