Consequences of mutations in the upstream promoter region
Consequences of mutations in the upstream promoter region
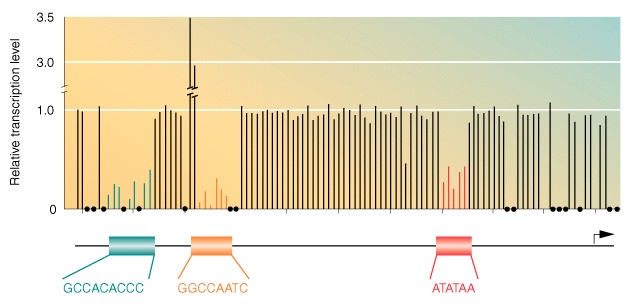
The effect of a
point mutation at each position upstream from the coding region
can be measured by comparing the level of mRNA
transcription relative to the un-mutated gene [vertical scale].
The graph shows that transcription is strongly reduced by
mutations in the promoter regions at -10 (ATATAA) & -35 (GGCCAATC),
and at an upstream enhancer
region. Note that mutations at either of two sites
immediately 5' to the -35
promoter sharply increase transcription. A mutation at
the start point of transcription (bent ![]() , fifth base from the 3' end) turns
off transcription entirely.
, fifth base from the 3' end) turns
off transcription entirely.
The large majority of mutations in this region have no measurable effect on transcription (relative transcription level ~ 1). Dots on the baseline are positions where the consequences of mutations are unknown.