Relationship of Phylogeny to a "Natural" Classification
The network
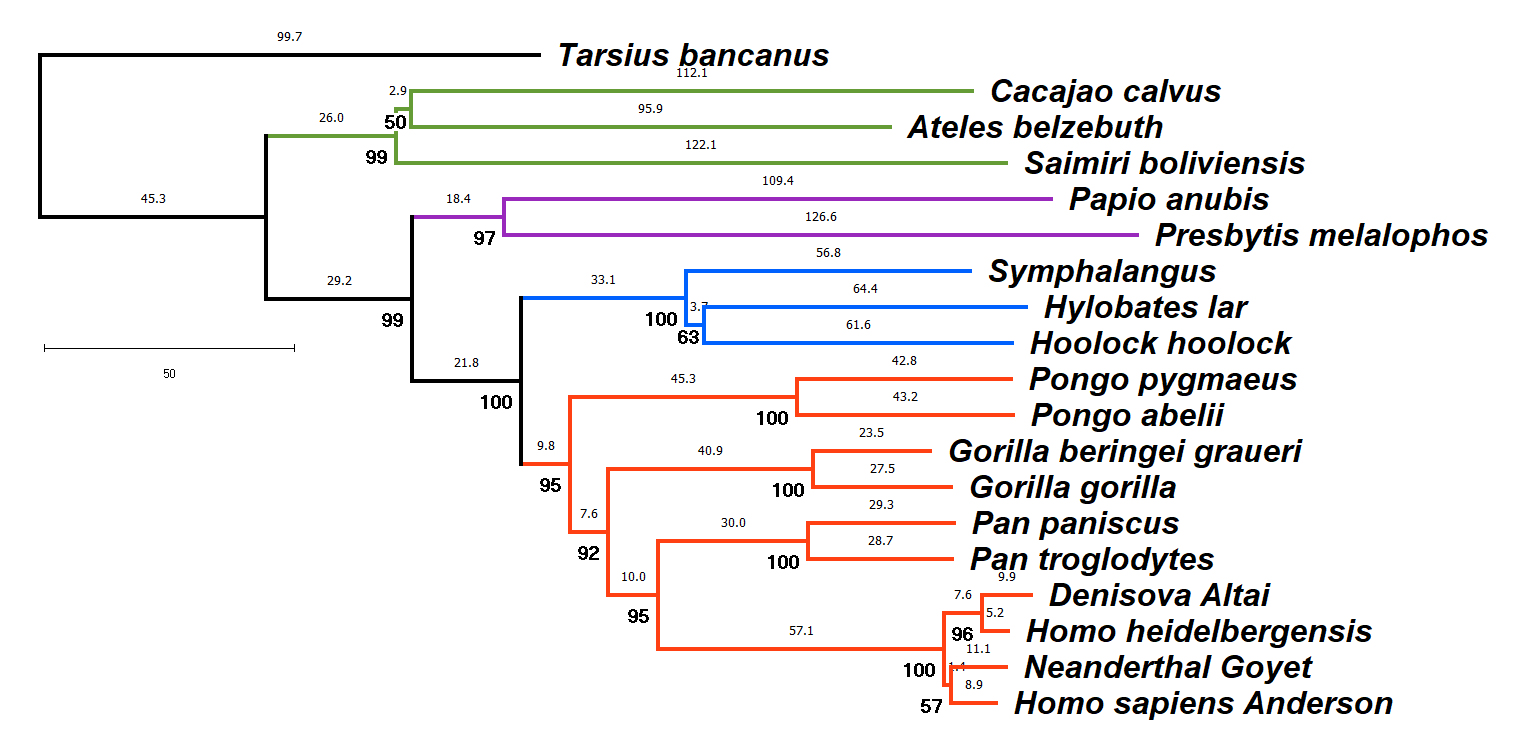
indicates the phylogeny (evolutionary history) of select
primates, including apes, monkey, and pro-simians. The creatures
shown are part of a single evolutionary lineage that has been
assigned the taxon (plural, taxa) name Primata
at the category rank of Order. The order Primata
includes several families (ending in -idae) including
Pongidae (Great Apes
including Humans), Hylobatidae
(Lesser Apes), Cercopithecidae
(Old World Monkeys), and Cebidae
(New World Monkey), each of which contains several genera (sing.,
genus). Each of these names labels a complete branch in
the evolutionary tree. Several of the genera include two (or
more) species (sing., species). [Without
exception, genus names are always capitalized, and
species names are always in lowercase].
This system is hierarchical
because the membership of any named category (species, genus,
family, order, etc.) is entirely contained within a successively
more inclusive category, and so on. The categories themselves
combine into recognized groups: P+H = Apes, P+H+C = Old World monkeys ,
and P+H+C+C'
= Simians (Man-like) including New World Monkeys, not
including the lemur-like Tarsiers.
The system is "natural"
because the hierarchy of names indicates the degree of
evolutionary relationship among organisms. Organisms
placed in the same genus are necessarily more closely related
than those in different genera in the same family, and organisms
in the same family are more closely related than those in
different orders.
In this system, relationship
determines classification. In previous systems,
classification was determined by perceived similarity: Great
Apes (Pongo, Gorilla, & Pan) were
placed in one family (Pongidae) and humans in another
(Hominidae). This taxonomy obscured their true relationships,
that chimps were the closest relatives of humans, and orangutans
(Pongo) were distant relatives to all the others.
The phylogeny shown here is inferred from molecular data, in
this case the protein-coding genes of mitochondrial DNA
genome sequences (ca.11,000 base pairs @). Numbers
above each branch indicate the number of nucleotide
substitutions inferred to occur along that branch (Maximum
Parsimony); numbers in bold below indicate the statistical
support for a branch (Bootstrap). The genetic differentiation
between any two species can be measured by summing the branch
lengths between them.