Measures of central tendency and dispersion
Quantitative phenomena can often be described by a measure of central tendency (the "average", or arithmetic mean), and a measure of dispersion, either the variance or the standard deviation.
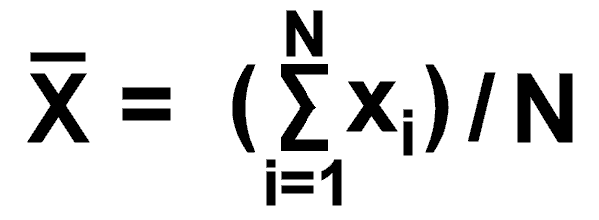
Mean = sum of i individual values of variable X, divided by number of individuals N

[read as, "X bar"]
The intuitive measure of dispersion is the average difference from the mean: however, the differences would be both above and below the means, and their sum would be zero.
To express average dispersion in terms of magnitude without regard to sign, the difference from the mean is squared.
Variance = average squared deviation of N individuals from the mean. By definition,

[read as, "sigma squared"]
Calculation of the variance by this formula is cumbersome, and variance is more easily calculated as

This traditional calculation can be remembered as "mean of squares" minus "square of means" [MOSSOM].
With a hand calculator, this requires only two summations, of the individual values, and their squares.
Standard deviation = square root of the variance. This expresses dispersion in the same units as the mean.
If all individuals of a population are included, the parametric standard deviation (s) is identical with the square root of the variance

Quantitative phenomena can often be described by a measure of central tendency (the "average", or arithmetic mean), and a measure of dispersion, either the variance or the standard deviation.
Mean = sum of i individual values of variable X, divided by number of individuals N

[read as, "X bar"]
The intuitive measure of dispersion is the average difference from the mean: however, the differences would be both above and below the means, and their sum would be zero.
To express average dispersion in terms of magnitude without regard to sign, the difference from the mean is squared.
Variance = average squared deviation of N individuals from the mean. By definition,

[read as, "sigma squared"]
Calculation of the variance by this formula is cumbersome, and variance is more easily calculated as

This traditional calculation can be remembered as "mean of squares" minus "square of means" [MOSSOM].
With a hand calculator, this requires only two summations, of the individual values, and their squares.
Standard deviation = square root of the variance. This expresses dispersion in the same units as the mean.
If all individuals of a population are included, the parametric standard deviation (s) is identical with the square root of the variance

