Regression Analysis of Y on X
Regression analysis
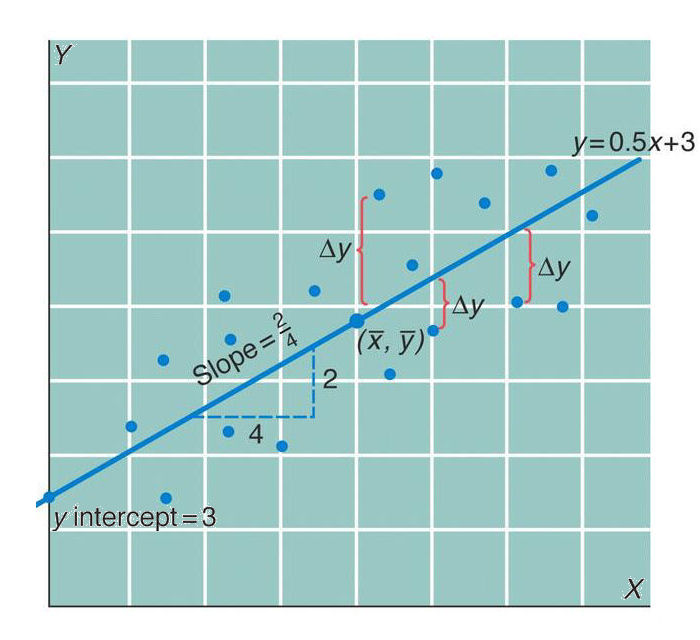
shows the relationship between two variables X and Y as a straight line that
minimizes, for a series of values of a predictive variable X,
the square of the difference between the expected value and observed values of the response variable Y.
The slope of the line is the regression coefficient (r),
which shows the strength of the predictability of Y from X. A slope of 1.0 indicates that Y is perfectly
predictable, and a slope of 0.0
that there is no relationship. Here, the slope of 0.5 indicates a strong but
imperfect relationship: small values of Y are typically associated
with small values of X,
and high with high, but note for example that of the
nine smallest values of X,
three are associated with the highest values of Y.
If the analysis is done as a test of association between X and Y rather than a prediction of Y by X, the correlation
coefficient (r2) should be used instead.
The calculations are
identical, but because r <
1, necessarily r2 < r. A properly-designed regression analysis requires that
the predictive X
variable be controlled, e.g., that the response Y is measured at
discrete, pre-determined values of X. A
common analytical error is to present an association analysis
between two uncontrolled variables as a prediction analysis: X is plausibly argued to
cause Y, and the
result is evaluated by r
instead of r2, so
as to obtain a higher number and by implication a stronger
prediction.