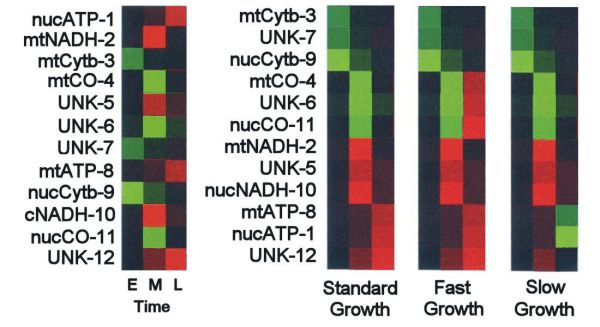
Hierarchical analysis of mt- & nuc-DNA gene expression arrays
The
figure
shows the results of a hypothetical experiment on fish growth
metabolism on a small portion of a quantitative gene expression
microarray. The array includes EST tags for cDNAs from
four mtDNA and four nucDNA loci that
contribute to nucleo-cytoplasmic holoenzymes (ATP-synthase, Cytochrome b, Cytochrome Oxidase, &
NADH) involved in
mitochondrial energy transactions. There are also four ESTs for a set of unknown ("UNK") mRNAs that
are abundant in the mitochondria. The order of tags is more or
less random.
In
the left-hand figure, mRNA expression is measured in Early, Middle, and Late-stage organisms (EML).
(These might correspond to pre-hatching, larval, and
metamorphosed fish). "Up-regulation",
that is, increased expression with respect to a control, is
indicated by a red pseudo-color,
and
"Down-regulation", reduced
expression, by green.
In the right-hand figure, bioinformatic analysis
sorts the 12 locus-specific expression patterns into groups
with similar EML
patterns, in
the Standard (Control), Fast- and Slow-growing
fish. There are four patterns, sorted as four clusters of loci:
"Early down-regulated"
(3,7,9)
"Middle
down-regulated" (4,6,11)
"Middle
up-regulated" (2,5,10)
"Late up-regulated"
(8,1,12)
Inspection of the results suggests the following interpretations. (1) In each cluster, a pair of nucleo-cytoplasmic loci are coordinately regulated, along with one of the unknown (UNK) loci. This suggests a hypothesis, that each UNK locus is involved with the corresponding holoenzyme. (2) Expression in Fast- and Slow growing fish shows no changes with respect to the Control. Changes in growth pattern may not be dependent on what happens at hatching. (3) Fish with altered growth rates do show characteristic changes in gene expression in the late-stage. In fast-growing fish, the CO system (4,6,11) is up-regulated in the late stage of Fast-growing fish. In contrast, in slow-growing fish, the ATP-synthase system (8,1) is down-regulated. in the late stage. (4) In slow-growing fish, expression of the presumptive ATP-associated locus UNK-12 remains unchanged (constitutive) in the late-stage, which indicates differential regulation of the ATP system.