Hierarchal analysis of mt- & nuc-DNA gene expression arrays
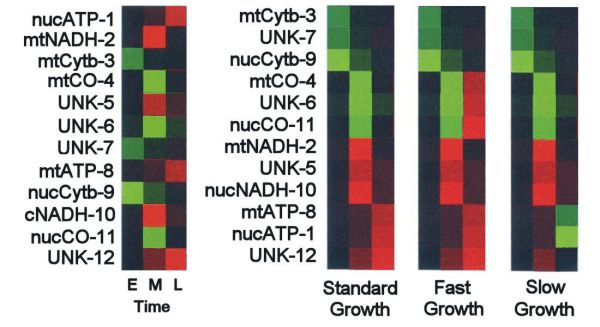
The diagram shows a hypothetical experiment with a small portion of a quantitative gene expression microarray, containing of 12 EST tags for four mtDNA and four nucDNA loci that contribute to nucleo-cytoplasmic holoenzymes (ATP-synthase, Cytochrome b, Cytochrome Oxidase, & NADH) involved in mitochondrial energy transactions, plus four cDNAs for unknown ("UNK") but mitochondrially-abundant mRNAs.
In the left hand figure, mRNA expression is measured in Early, Middle, and Late-stage organisms. “Up-regulation”, that is, increased expression with respect of a control, is indicated by a red pseudo-color, and “Down-regulation” by green. Bioinformatic analysis (such as TreeView) performs a hierarchal clustering that sorts the 12 locus-specific expression patterns into groups with similar patterns.
Consider three lines of fish that show standard, fast, and slow growth. Four patterns are detected in fish with standard (control) growth rates: “early down-regulated” (##3,7,9); “middle down-regulated” (4,6,11), “middle up-regulated: (2,5,10), and “late up-regulated” (8,1,12). In each cluster, the nucleo-cytoplasmic loci are coordinately regulated, along with one of the unknown (UNK) loci. This creates a hypothesis that each UNK locus is involved in control of of a particular holoenzyme. Fish with altered growth rates show characteristic changes in gene regulation. In fast-growing fish, the CO system (4,6,11) is up-regulated in late-stage (e.g., post-hatching) larvae. In slow-growing fish, the ATP-synthase system (8,1) is down-regulated, and the presumptive ATP-related locus UNK-12 remains constitutive.
Differential
patterns of expression in fish with variable growth (or other)
responses can be correlated with specific mitochondrial and/or nuclear
SNPs.