In general, parsimony is the principle that the simplest explanation that can explain the data is to be preferred. In the analysis of phylogeny, parsimony means that a hypothesis of relationships that requires the smallest number of character changes is most likely to be correct. In molecular systematics, these character changes are DNA mutations.
Suppose that we wish to determine the evolutionary relationships among four taxa: A, B, C, & D. With respect to taxon A, there are three hypotheses: A is most closely related to B, or to C, or to D. These three hypotheses of cladistic relationships can be diagrammed respectively as follows (the diagrams are called cladograms):
A C
A B
A B
|__| |__|
|__|
| | | |
| |
B D
C D
D C
Portions of these phylograms shown as '|' are branches, and '__' is the internode. The most closely related pairs of taxa are on either side of the internode. For example, the first diagram shows A & B as more closely related to each other than either is to C or D.
A typical data set to evaluate these hypotheses would be homologous, short DNA sequences from each taxon. In the figure below, only the coding DNA strand is shown: nucleotides in the last three lines are identical to those in the first, except where indicated:
A aat tcg ctt cta gga atc tgc cta atc ctg
B ... ..a ..g ..a .t. ... ... t.. ... ..a
C ... ..a ..c ..c ... ..t ... ... ... t.a
D ... ..a ..a ..g ..g ..t ... t.t ..t t..
1 2 3 4
5 6
7
Two kinds of nucleotide positions can be distinguished, informative and uninformative. Informative positions are those that give information about evolutionary relationships among taxa; uninformative sites don't. In our four-taxon problem, an informative position will indicate that one of the three hypotheses is the simplest (most parsimonious) explanation of the mutational pattern implied by the data, that is, that it requires fewest mutational changes.
What is the information content of each of the seven numbered positions?
1. Position 1 is invariant: it gives no information about relationships among these taxa. The majority of sites are like this.
2. Position 2 is variable,
but still gives no information: it indicates only that A is different
from the other three taxa, or, put another way, that B, C,
& D are similar but not that they are closely
related The unique change in A at this position is therefore an
autoapomorphy [a change unique to one
taxon under study]. Position 2 can be explained by a single mutational
change in any of the three trees. In the diagrams below, '+' indicates
a change from 'a' [in B C & D] to
'g' on the branch leading to taxon A: ![]() g. [The same would be true if any one of the other three taxa were
uniquely variable at this site.] Most variable sites are of this type:
five are shown in the figure above (find them)
g. [The same would be true if any one of the other three taxa were
uniquely variable at this site.] Most variable sites are of this type:
five are shown in the figure above (find them)
nuc
g a g a
g a
Taxon
A C A B
A B
+__| +__|
+__|
| | | |
| |
Taxon
B D C D
D C
nuc
a a a a
a a
3. Position 3 is extremely variable, but again there is no information: every taxon is different from every other. Position 3 requires three mutations in any of the three trees. [Under certain models of molecular evolution, this site would be informative].
4. Position 4 is less variable, but once again there is no information: although it might appear at first glance that this site favours the Tree 1 over the latter two, in fact each tree can be explained with two changes:
a c a c
a a a a
A C A C
A B A B
|___+ or |_+_+ |___|
|___|
| + | |
+ + + +
B D B D
C D D C
a g a g
c g c g
There are many variants on this type of site, all of which are uninformative. The similarity of A & B is thus due to a shared ancestral character [a symplesiomorphy], which does not necessarily indicate that they are closely related. [Under certain models of molecular evolution, this type of site would be informative].
5.
Position 5 is informative: it indicates
that A & B
are each others' closest relatives, that is, that the
first tree is the most parsimonious explanation. To explain this
distribution requires a single change on the internode in Tree 1
(a ![]() g), and
two changes each on branches in Trees 2 & 3. The similarity
of A & B would thus be interpreted as a shared
derived character [a synapomorphy].
Two such sites are shown (find the other).
g), and
two changes each on branches in Trees 2 & 3. The similarity
of A & B would thus be interpreted as a shared
derived character [a synapomorphy].
Two such sites are shown (find the other).
a g a a
a a
A C A B
A B
|_+_| +___+
+___+
| | | |
| |
B D C D
D C
a g g g
g g
6. Position 6 is also informative: it indicates that A & Care each others' closest relatives, so that the second tree is the most parsimonious explanation. The similarity of A & C would thus be interpreted as a shared derived character [a synapomorphy]. To explain this distribution requires a single change in Tree 2, and two changes in Trees 1 & 3:
c c c t
c t
A C A B
A B
+___+ |_+_|
+___|
| | | |
| +
B D C D
D C
t t c t
t c
7. Finally, Position 7 is informative: it indicates that A & Dare each others' closest relatives, so that the third tree is the most parsimonious explanation. The similarity of A & D would thus be interpreted as a shared derived character [a synapomorphy]. To explain this distribution requires a single change in Tree 3, and two changes in Trees 1 & 2:
g a g a
g a
A C A B
A B
+___| +___|
|_+_|
| + | +
| |
B D C D
D C
a g a g
g a
An evolutionary parsimony analysis counts the number of informative positions favouring each of the (in this case, three) possible trees: whichever is in the majority will indicate the most parsimonious tree.
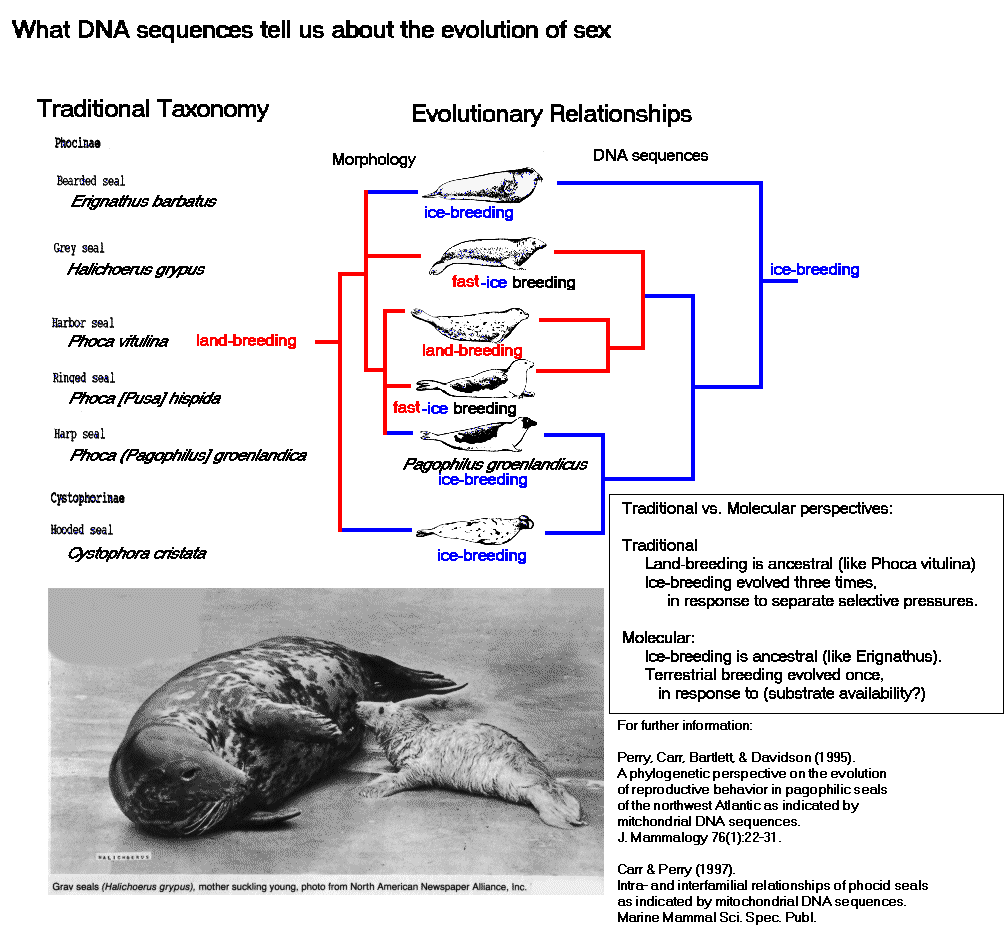
For example, the data set below can be used to investigate the relationship of Pagophilus groenlandicus (harp seals) to other phocid seals of the North Atlantic (see Carr & Perry 1997). A total of four sites favour (Pagophilus + Phoca), six sites favour (Pagophilus + Cystophora) as closest relatives, and only three favour (Pagophilus + Erignathus). [Identify all these sites]. Pagophilus thus appears to be most closely related to Cystophora.
Similar principles can be used to evaluate data sets with larger number of taxa. However, the number of possible trees increase hypergeometrically: with seven taxa, there are 945 possible trees, with ten, over two million, and with 22, over 3 x 10²³. It is obviously impractical to inspect all possible trees: a number of computerized search algorithms have been developed, notably the PAUP (Phylogenetic Analysis Using Parsimony) package of Dave Swofford (see Swofford et al. 1995. In "Molecular Systematics" (D. Hillis et al., eds.) Sinauer.) and the PHYLIP package of Joe Felsenstein (Univ. of Washington).
M T N I R K
T H P L M K
I I N N S F
I D L P A P
S 25
Pagophilus atg
acc aac atc cga aaa acc cac cca cta ata aag att atc aac aac tca ttc atc
gac cta ccc gca cca tca 75
Phoca
... ... ... ... ... ... ... ..t ... ... ... ..a ... ... ... ... ... ...
... ... ... ... a.. ... ...
Cystophora ...
... ... ... ... ... ... ... ... ... ... ..a ... ... ... ... ... ... ..t
... ... ... a.. ... ...
Erignathus ...
... ... ... ... ... ..t ... ... ... ..c ..a ..c ... ... .g. ... ... ...
... ... ... a.. ..g ...
N I S A W W
N F G S L L
V I C L I L
Q I L T G L
F 50
Pagophilus aat
atc tca gca tga tga aac ttt gga tcc ctg ctc gta atc tgc tta
atc cta cag atc cta aca ggc cta ttc
150
Phoca
... ... ... ... ... ... ... ... ... ..t ..t
... .g. ... ... c.. ... ..g
..t ... t.. ... ... t.g ...
Cystophora ..c
... ... ... ... ... ... ... ... ... ..c ... .g. ... ... ...
... t.. ... ... ... ... ... ... ...
Erignathus ..c
... ... ... ... ... ... ..c ... ... ..c ... .gg ... ... c.t
..t t.. ..a ... ... ... ... ... ...
L A M H Y T
S D T I T A
F S S V T H
I C R D V N
Y 75
Pagophilus ctg
gcc ata cat tat acc tca gac aca atc
aca gcc ttc tca tca gtg acc cat atc
tgt cga gac gta aac tac 225
Phoca
..a ... ... ..c ..c ... ... ... ... .c. ...
... ... ... ... ..a ... ..c ... ..c ... ...
... ... ...
Cystophora ..a
... ... ... ... ..t ... ... ... .ct ... ...
... ..g ... ..a ..a ..c ... ... ... ... ...
... ...
Erignathus ..a
... ... ... ..c ... ... ..t ... .c. ... ..t
... ... ... ..a ... ... ... ... ...
... ... ..t ..t
G W I I R Y
L H A N G A
S M F F I C
L Y M H V G
R 100
Pagophilus ggc
tga atc atc cga tac cta cac gca aat
gga gcc tcc ata ttt ttc atc tgc tta
tac ata cac gta gga cga 300
Phoca
... ... ... ... ..t ..t ..t ... ... ... ...
..t ... ... ... ... ... ... c.. ... ..g ..t
... ... ...
Cystophora ...
... ..t ... ... ..t ... ... ... ... ... ...
... ... ... ... ... ... c.g ... ... ... ..g
... ...
Erignathus ...
... ..t ... ... ..t a.. ... ..t ..c ... ..t
..t ... ..c ... ... ... c.. ... ... ..t ...
... ...
G L Y Y G S
Y T F T E T
W N I G I I
L L F T V M
A 125
Pagophilus gga
ctc tac tac ggt tcc tac aca ttc aca
gaa aca tga aat
atc ggc att atc ctc cta ttc acc gtc
ata gct 375
Phoca
... ..g ..t ... ..c ... ... ... ... ... ..g
... ... ..c ... ... ... ... ... t..
... ... ... ... ..c
Cystophora ...
..g ... ... ..c ... ... ... ..t ... ..g
... ... ... ... ... ... ... ... t..
..t ..t ... ... ...
Erignathus ...
..a ... ... ..c ..t ..t ... ..t .t. ...
... ... ..c ... ... ... ... ..a ...
... ... ... ... ..c
T A F M G Y
V L
133
Pagophilus acg
gca ttc atg ggt tac gtc cta cc
401
Phoca
..a ... ... ... ..c ... ... ... ..
Cystophora ..a
... ... ... ..c ... ... ... ..
Erignathus ..a
... ... ..a ..c ... ... ... ..
401 base pair portion of the mitochondrial cytochrome b gene from four species of phocid seals (Phoca = harbour seal, Pagophilus = harp seal, Cystophora = hooded seal, Erignathus = bearded seal). Nucleotides are the same as in Phoca except where indicated; the inferred amino acid sequence for Phoca is indicated by the IUPAC single-letter code. Data from Carr and Perry (1997); cf. Perry et al. (1995) "Journal of Mammalogy," 76:22-31